Fig. 1.
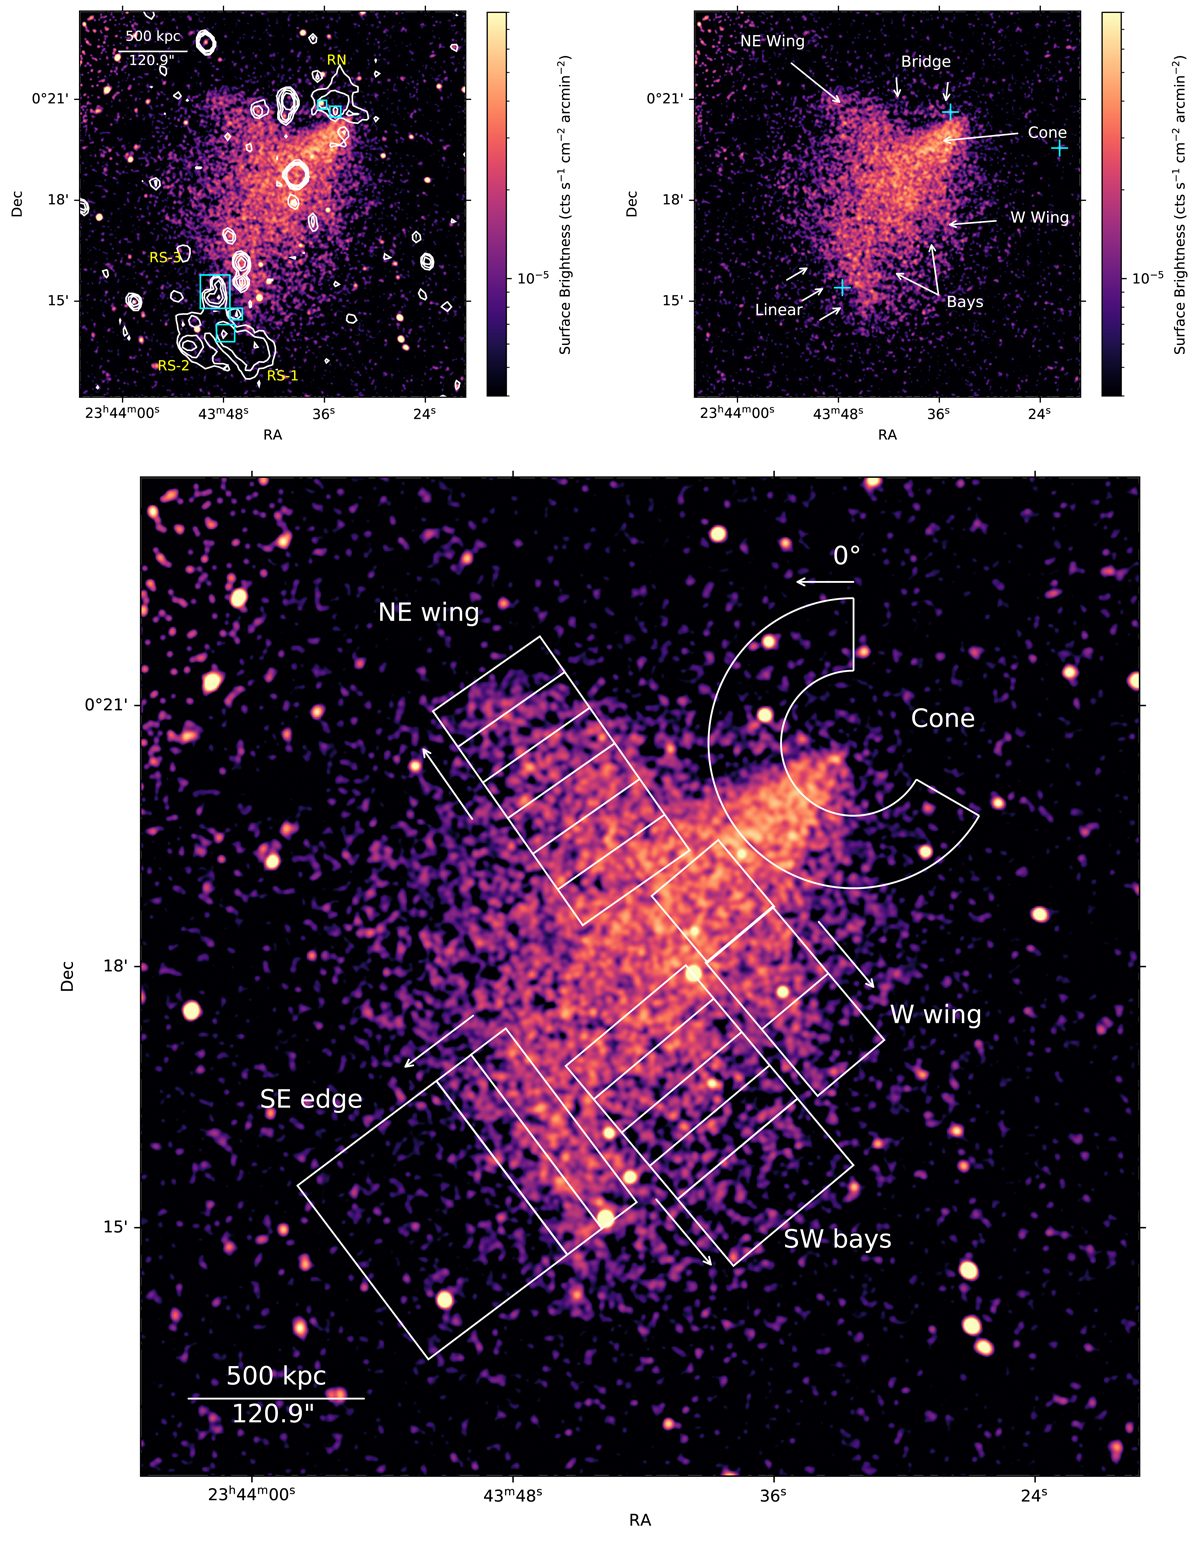
Download original image
Top left: X-ray flux map in the 0.5−2.0 keV band convolved with a σ = 1.97″ (four pixel) Gaussian kernel. Overlaid are the JVLA C-array 1.5 GHz radio contours at [1, 2, 4]×0.075 mJy beam−1. The terms of the relic sources RS-1–3 and RN are introduced by van Weeren et al. (2009). Identified point sources that overlap with the southern relic are marked by cyan boxes. Top right: image from which point sources have been removed. Surface brightness features are labeled. The locations of the three brightest cluster galaxies adopted from Benson et al. (2017) are marked as cyan crosses. Bottom: extraction regions used for detailed X-ray analysis in Sect. 3. For the regions SE edge, SW bays, western wing, and NE wing, the individual temperature bins in Fig. 6 are plotted. The arrows beside each bin indicate the directions of the profiles.
Current usage metrics show cumulative count of Article Views (full-text article views including HTML views, PDF and ePub downloads, according to the available data) and Abstracts Views on Vision4Press platform.
Data correspond to usage on the plateform after 2015. The current usage metrics is available 48-96 hours after online publication and is updated daily on week days.
Initial download of the metrics may take a while.