Fig. 7.
Download original image
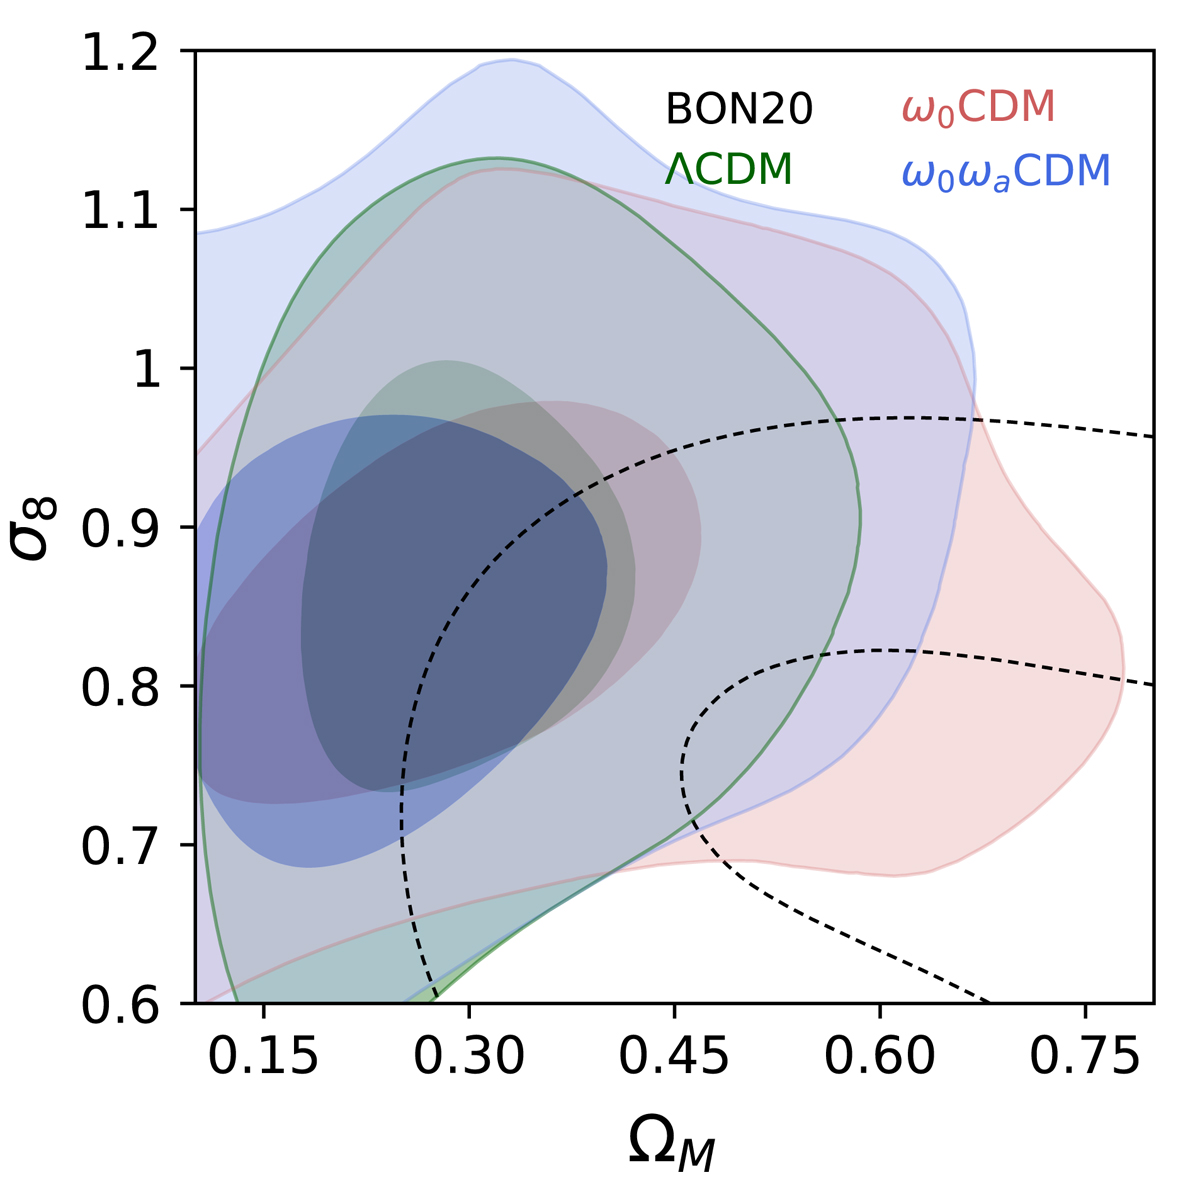
Contour plot of the two-dimensional posterior distribution of ΩM and σ8 for the three MCMC runs where the astrophysical and cosmological parameters are jointly analysed, namely within ΛCDM (in green), within ω0CDM (in red), and within ω0ωaCDM (in blue). Moreover, in order to compare with previous results, those by Bonavera et al. (2020) are shown in black. The contours are set to 0.393 and 0.865.
Current usage metrics show cumulative count of Article Views (full-text article views including HTML views, PDF and ePub downloads, according to the available data) and Abstracts Views on Vision4Press platform.
Data correspond to usage on the plateform after 2015. The current usage metrics is available 48-96 hours after online publication and is updated daily on week days.
Initial download of the metrics may take a while.