Fig. 1.
Download original image
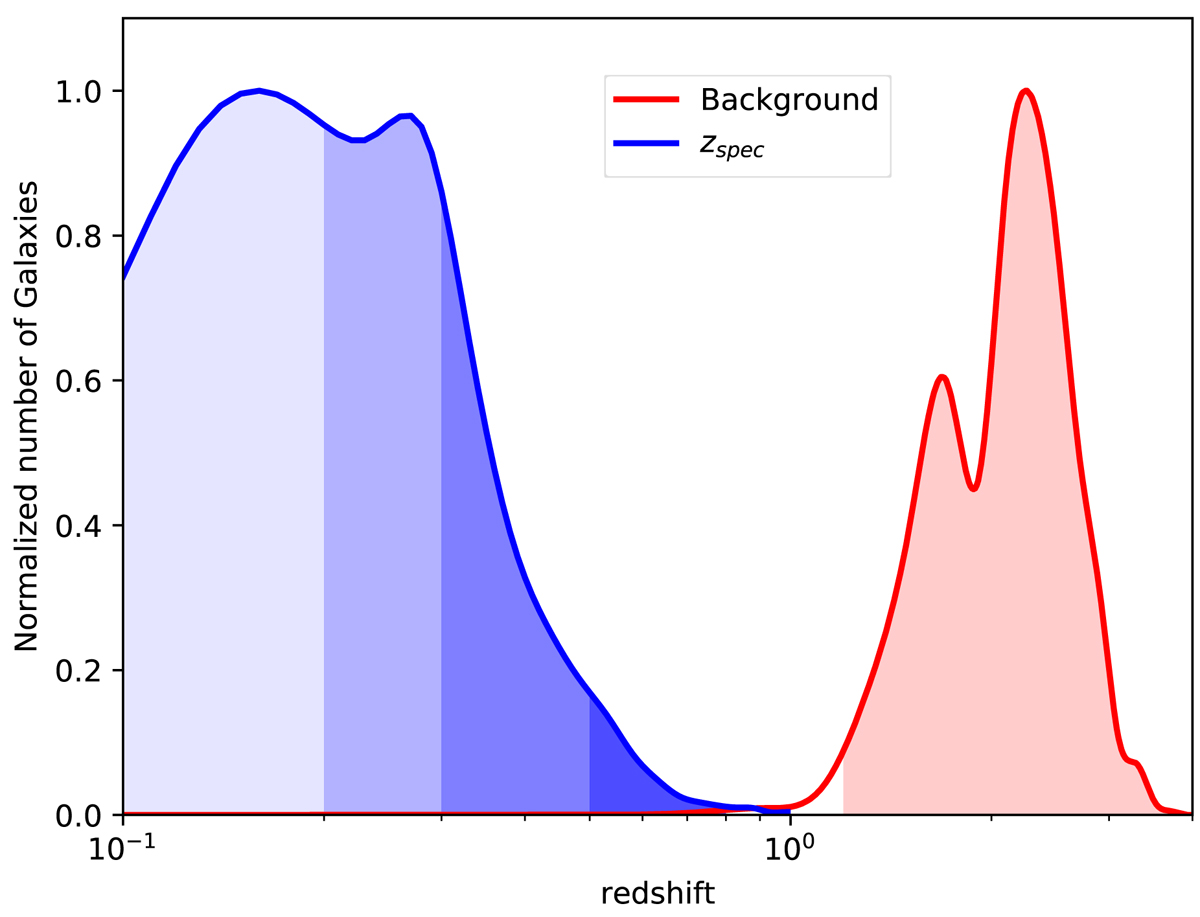
Normalised redshift distribution of the background (red line) and foreground (blue line) samples. The coloured areas represents the selected ranges of redshift: in red the 1.2 < z < 4.0 interval for the background SMGs sample and in different shades of blue the 0.1 < z < 0.2, 0.2 < z < 0.3, 0.3 < z < 0.5, and 0.5 < z < 0.8 bins for the foreground GAMA galaxies.
Current usage metrics show cumulative count of Article Views (full-text article views including HTML views, PDF and ePub downloads, according to the available data) and Abstracts Views on Vision4Press platform.
Data correspond to usage on the plateform after 2015. The current usage metrics is available 48-96 hours after online publication and is updated daily on week days.
Initial download of the metrics may take a while.