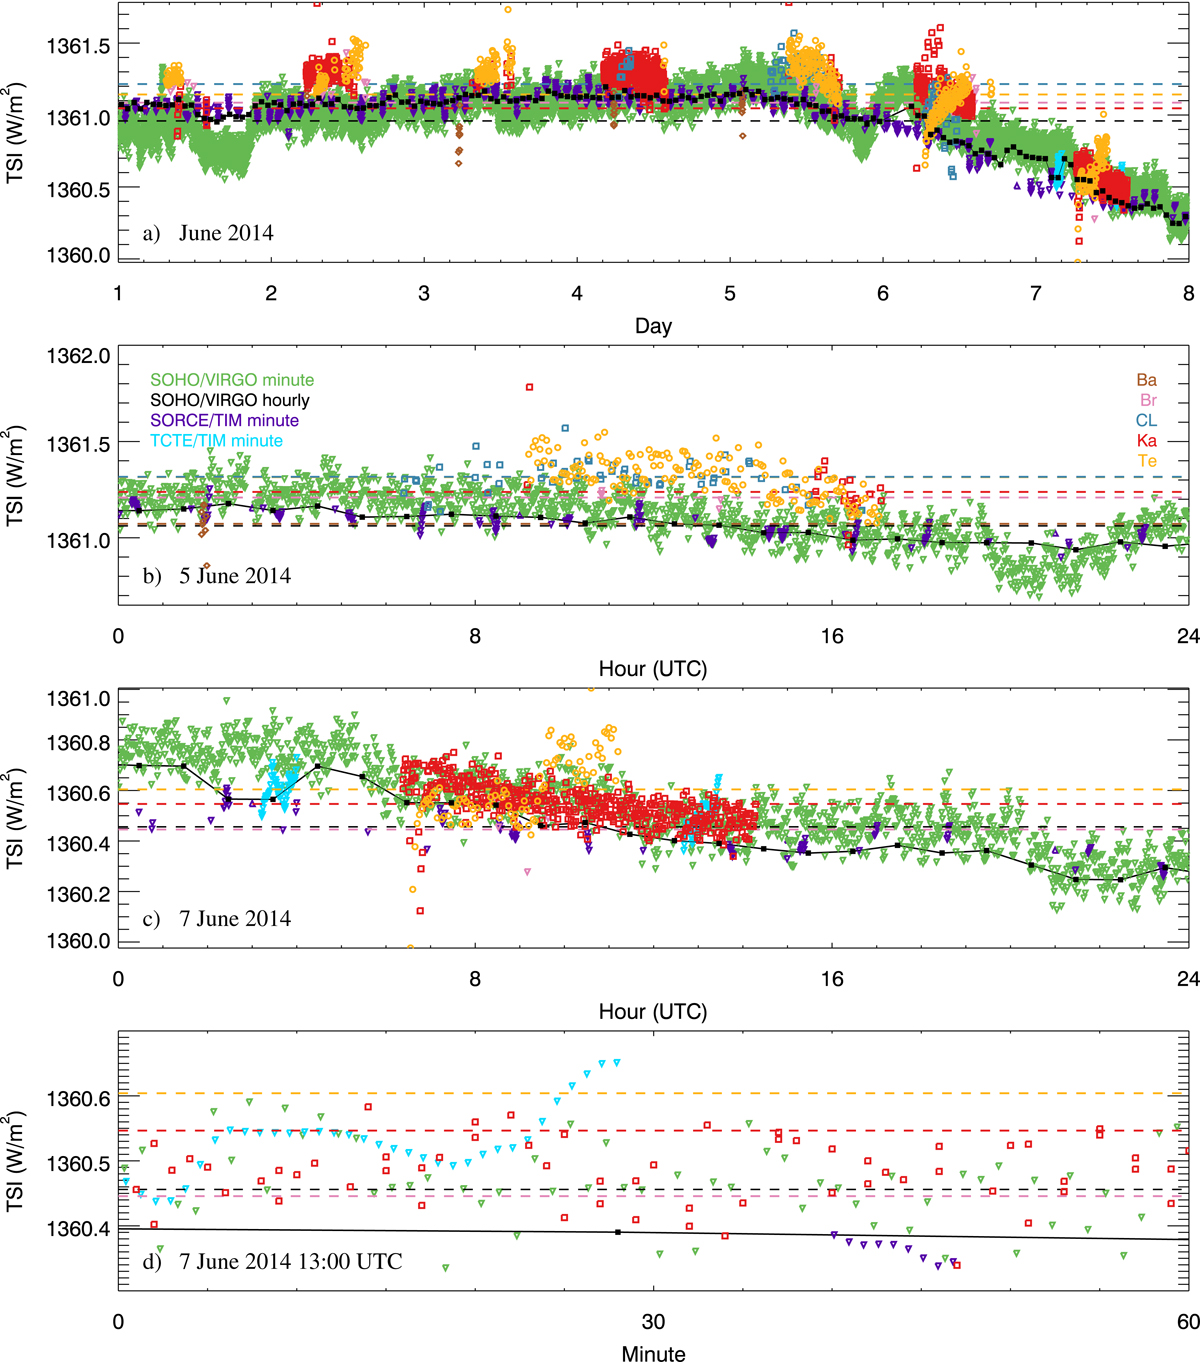
Fig. 9.
Download original image
Reconstructed TSI from Ca II K observations using SOHO/VIRGO data (daily values) as the reference over the course of the first week of June 2014 (panel a), on 5 June 2014 (panel b), 7 June 2014 (panel c), and between 13:00 and 14:00 UTC on 7 June 2014 (panel d). The reconstructed TSI is based on the images from Ba (brown rhombuses), Br (pink downward triangles), CL (blue empty squares), Ka (red empty squares), and Te (orange circles). Also shown are the TSI measurements by SOHO/VIRGO (black filled squares connected by the black solid line for hourly values and green downward triangles for data with the cadence of 60 s), SORCE/TIM (purple downward triangles; cadence of 50 s), and TCTE/TIM (ciel downward triangles; cadence of 50 s). In contrast to all other figures where TSI series reconstructed from Ca II K data are shown as daily means over all individual images on that day, here we show the results for each individual image. The horizontal dashed lines mark the mean TSI value of each corresponding series over the specified period, except for panel d, in which the horizontal lines mark the daily mean value.
Current usage metrics show cumulative count of Article Views (full-text article views including HTML views, PDF and ePub downloads, according to the available data) and Abstracts Views on Vision4Press platform.
Data correspond to usage on the plateform after 2015. The current usage metrics is available 48-96 hours after online publication and is updated daily on week days.
Initial download of the metrics may take a while.