Fig. 6.
Download original image
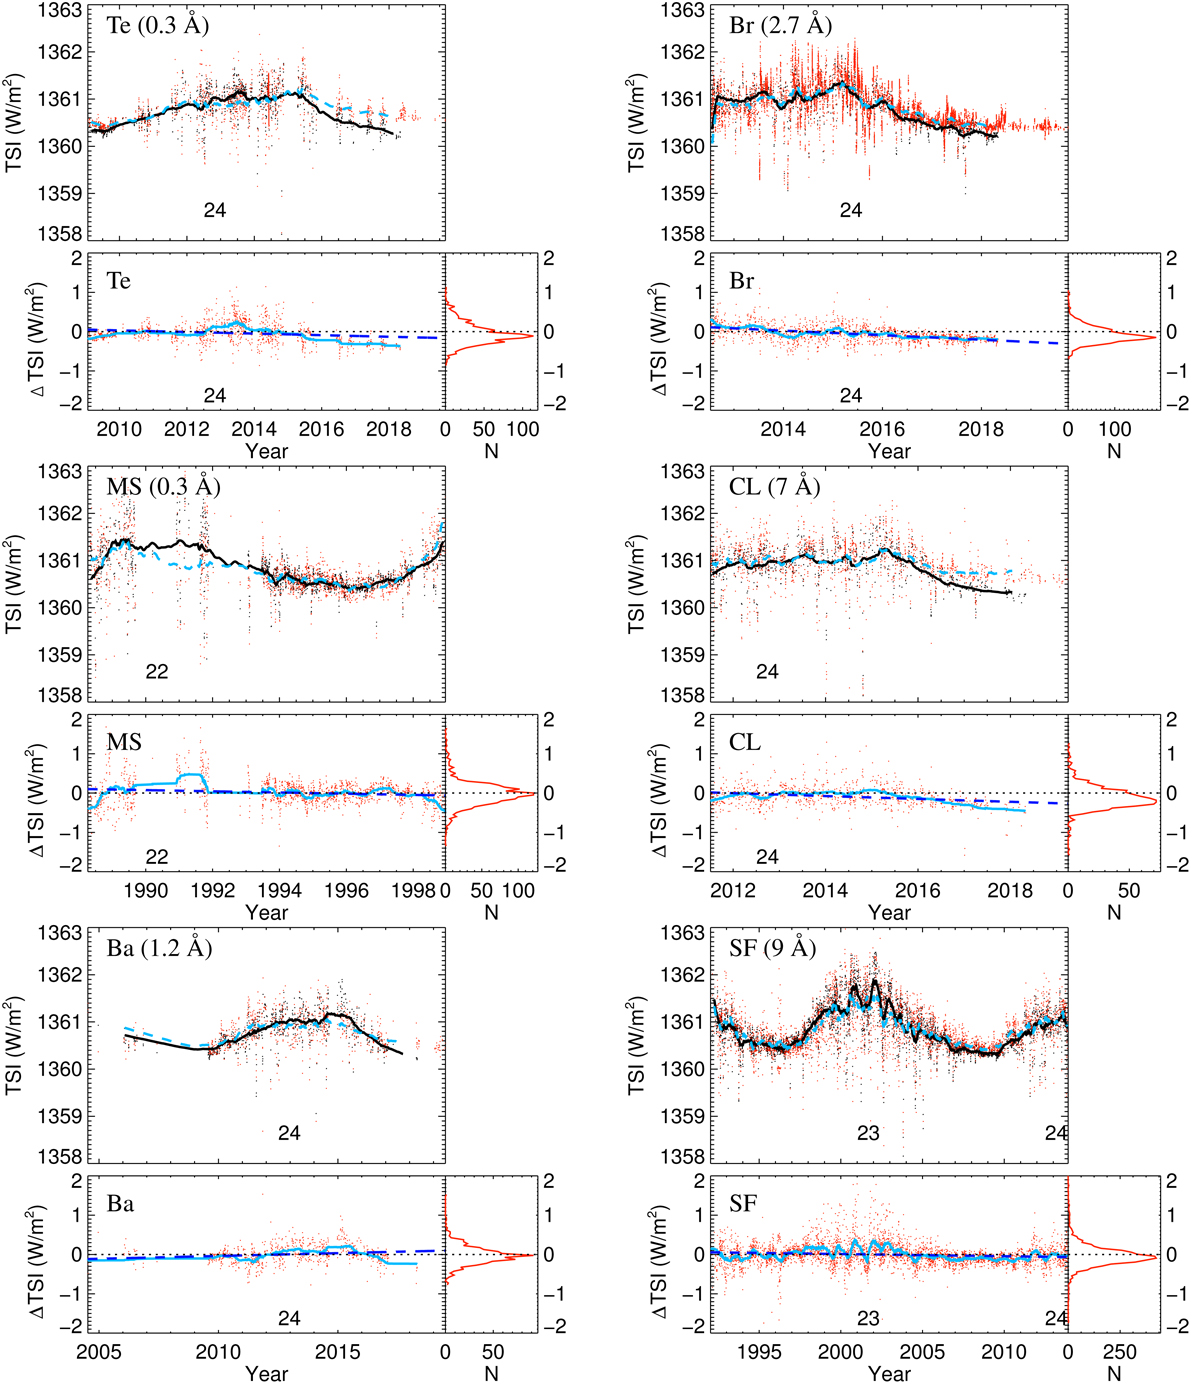
Upper part of each panel: TSI reconstructions from Ca II K observations taken with filters that are narrower (left column) or broader (right column) than RP. Daily values from the Te, Br, MS, CL, Ba, and SF datasets are shown as red dots and the corresponding 81-day running means as dashed blue lines. For comparison, the PMOD irradiance composite series is overplotted (black dots for daily values and the solid black line for the 81-day running means). The running means have been computed considering only days on which both the reconstructions and the PMOD series were available. Lower left part of each panel: difference between the PMOD composite and the reconstructed TSI (red dots for daily values and solid light blue for 81-day running means). The dashed blue line is a linear fit to the residuals. The horizontal black dotted line marks the zero difference. Lower right part of each panel: distribution of the residuals in bins of 0.05 Wm−2. The numbers at the bottom of each panel indicate the solar cycle number and are placed roughly around the maximum of the corresponding cycle.
Current usage metrics show cumulative count of Article Views (full-text article views including HTML views, PDF and ePub downloads, according to the available data) and Abstracts Views on Vision4Press platform.
Data correspond to usage on the plateform after 2015. The current usage metrics is available 48-96 hours after online publication and is updated daily on week days.
Initial download of the metrics may take a while.