Fig. 3.
Download original image
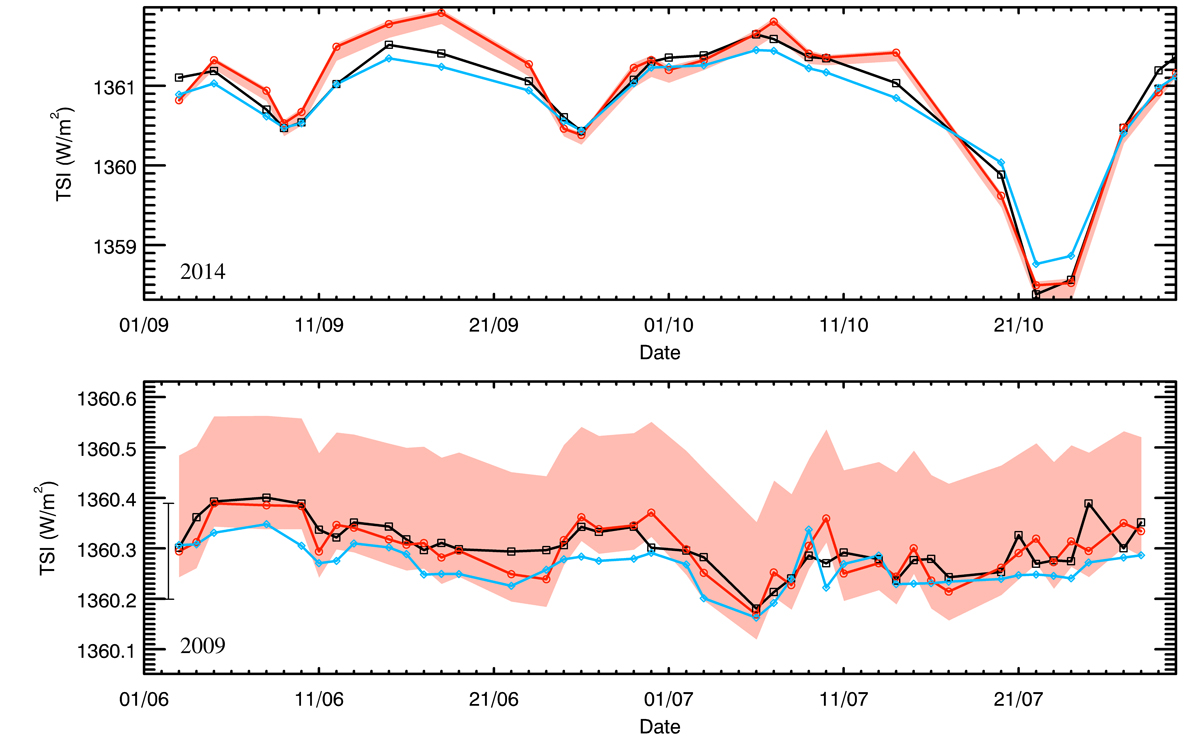
TSI reconstructed from RP Ca II K data (red circles for daily values connected by the red line) during 2-month periods September–October 2014 (close to activity maximum, top panel) and June–July 2009 (around activity minimum, bottom panel). Also shown are the PMOD TSI composite (black squares and black curve) and the SATIRE-S TSI series (light blue diamonds and line). All series are only shown on the days when RP observations are available. The red shaded area shows the entire range of TSI obtained from RP Ca II K data using different reference series. We note that the range of TSI values shown in the two panels differs. To ease the comparison, the error bar in the lower panel marks the maximum range of the red shaded surface over the 2-month interval in 2014 shown in the top panel.
Current usage metrics show cumulative count of Article Views (full-text article views including HTML views, PDF and ePub downloads, according to the available data) and Abstracts Views on Vision4Press platform.
Data correspond to usage on the plateform after 2015. The current usage metrics is available 48-96 hours after online publication and is updated daily on week days.
Initial download of the metrics may take a while.