Fig. 2.
Download original image
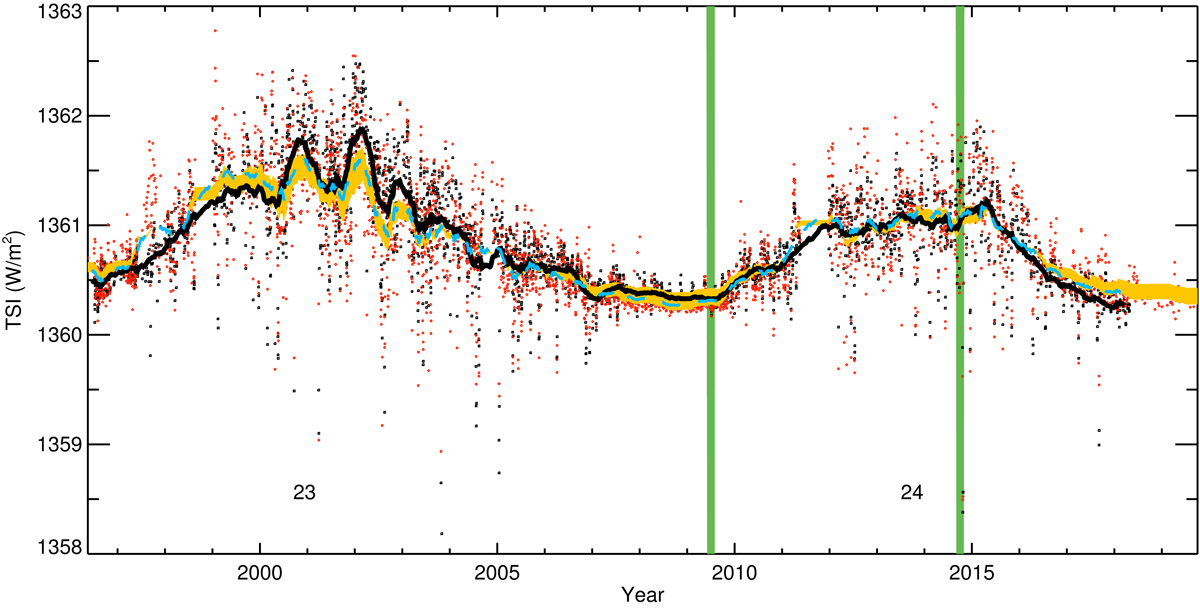
TSI reconstructed with RP Ca II K data (red circles for daily values and light blue dashed line for 81-day running mean values) using the PMOD TSI series as the reference as a function of time. Also shown is the PMOD TSI composite (black squares for daily values and black solid line for 81-day running mean values). The orange shading shows the range of the TSI reconstructions (81-day running means) obtained with the minimum and maximum Bsat value determined from all reference TSI series considered here (see Table 3). The numbers underneath the curves denote the solar cycle numbers, while the green vertical bars mark the intervals shown in Fig. 3. The running means are produced by considering only the days on which both series are available.
Current usage metrics show cumulative count of Article Views (full-text article views including HTML views, PDF and ePub downloads, according to the available data) and Abstracts Views on Vision4Press platform.
Data correspond to usage on the plateform after 2015. The current usage metrics is available 48-96 hours after online publication and is updated daily on week days.
Initial download of the metrics may take a while.