Fig. B.2.
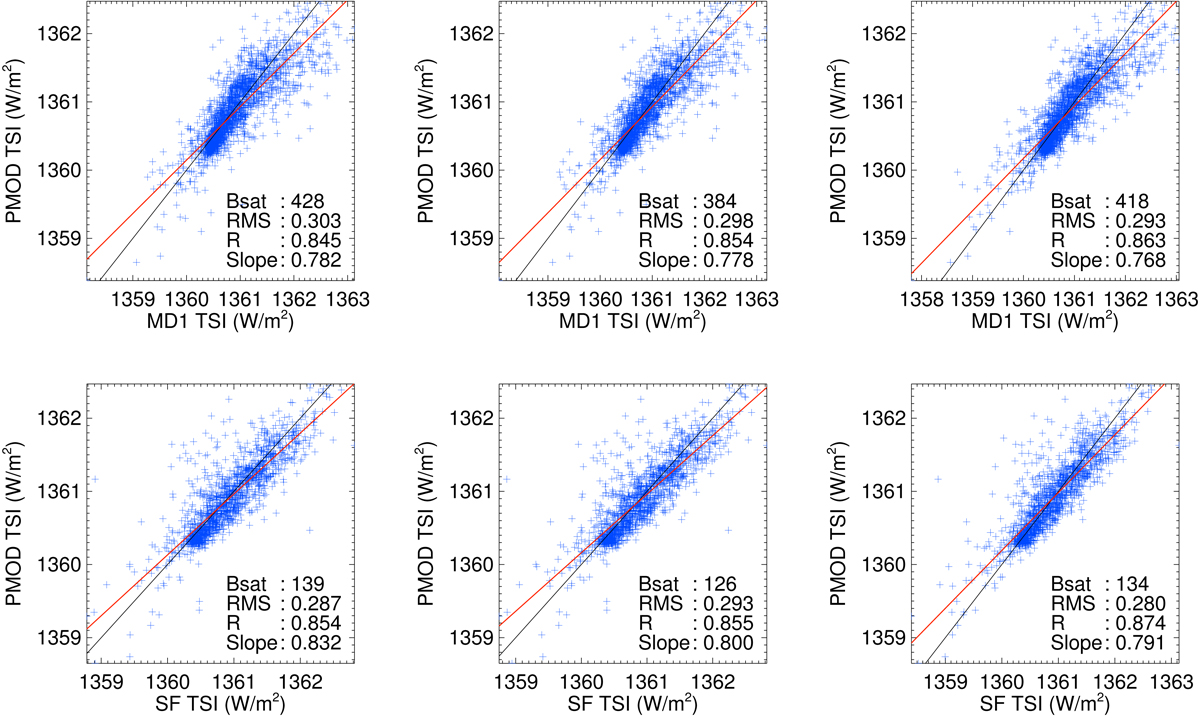
Download original image
TSI reconstructed from MD1 (top row) and SF (bottom row) Ca II K images versus the PMOD TSI composite. Left: Sunspot information taken from Mandal et al. (2020) without any correction to the faculae filling factors due to sunspots; Middle: Sunspot information taken from Mandal et al. (2020) and the sunspot filling factors are subtracted from the facular ones; Right: Sunspot information is derived from the full-disc RP red-continuum images. The red lines show linear fits to the data, while the black lines have a slope of unity. Also listed in each panel are the Bsat (in G), RMS difference (in W/m2), the linear correlation coefficient, and the slope of the linear fit.
Current usage metrics show cumulative count of Article Views (full-text article views including HTML views, PDF and ePub downloads, according to the available data) and Abstracts Views on Vision4Press platform.
Data correspond to usage on the plateform after 2015. The current usage metrics is available 48-96 hours after online publication and is updated daily on week days.
Initial download of the metrics may take a while.