Fig. B.1.
Download original image
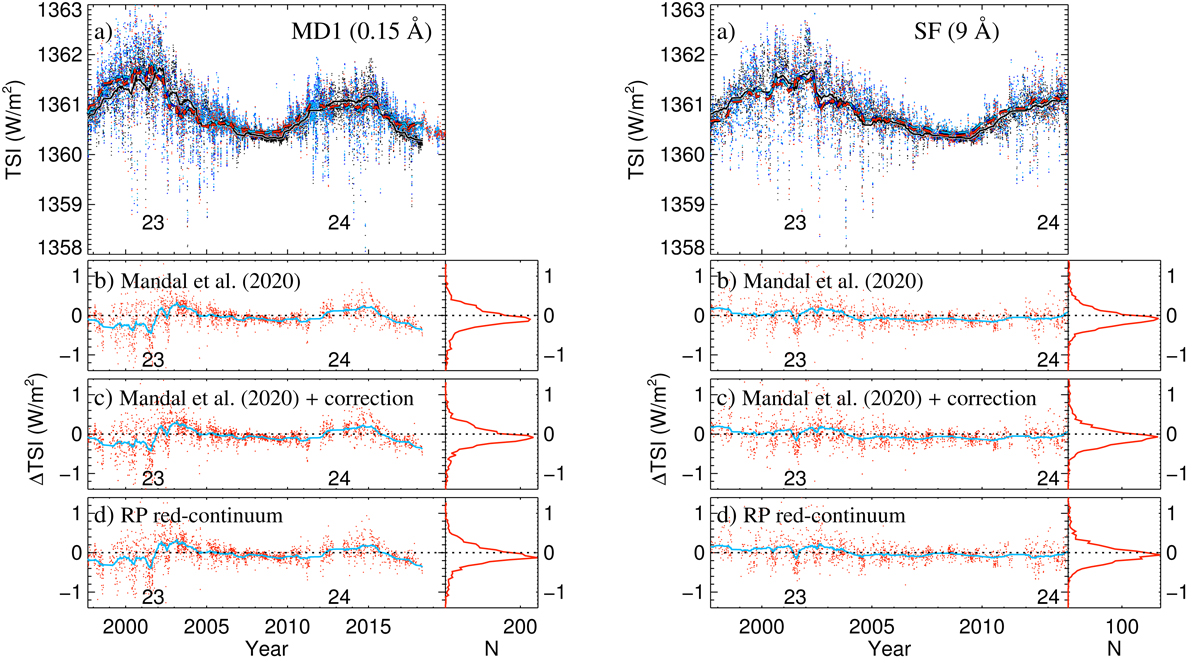
TSI reconstructed with MD1 (left panels) and SF (right panels) Ca II K data as a function of time (a) and difference of TSI reconstructions to the PMOD TSI composite (b–d) when using different approaches to account for the sunspots: using the Mandal et al. (2020) series to get the sunspot filling factors (light blue in panel a and red in panel b); using the Mandal et al. (2020) series to get the sunspot filling factors which were also subtracted from those of faculae (blue in panel a and red in panel c); using full-disc Rome/PSPT red continuum data (red in panel a and d) to get the sunspot filling factors (see Sect. 4.2 for more information). The differences are shown only for the common days in all series. Also shown in panel a is the PMOD TSI composite (black). Thick lines show 81-day running mean values. The right part of the lower panels show the distributions of the differences in bins of 0.05 Wm−2.
Current usage metrics show cumulative count of Article Views (full-text article views including HTML views, PDF and ePub downloads, according to the available data) and Abstracts Views on Vision4Press platform.
Data correspond to usage on the plateform after 2015. The current usage metrics is available 48-96 hours after online publication and is updated daily on week days.
Initial download of the metrics may take a while.