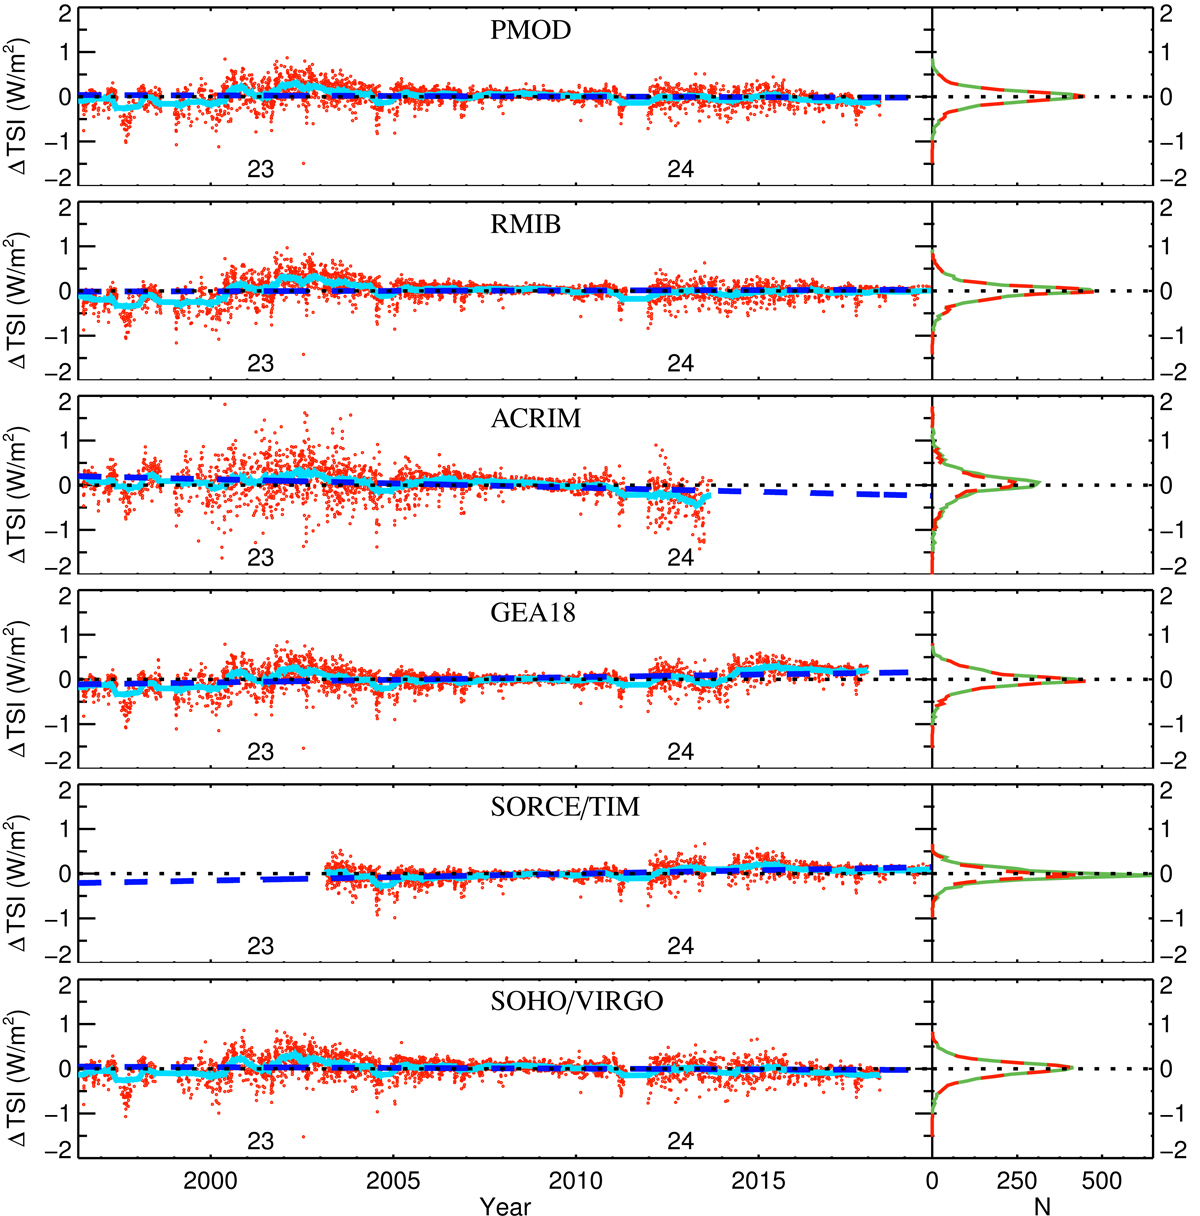
Fig. A.1.
Download original image
Left: Difference between the various TSI reference series and the TSI calculated from RP Ca II K data (red circles for daily values and light blue curve for 81-day running mean values) using the respective TSI reference series as a function of time. The TSI reference series used are PMOD, RMIB, ACRIM, GEA18, SORCE/TIM, and SOHO/VIRGO. Also shown is a linear fit to the residuals (dark blue dashed line). The horizontal dotted black line denotes the zero level difference. The numbers in the lower part of the panels denote the solar cycle number. Right: Distributions of the residuals in bins of 0.05 Wm−2 for the series shown in the left panels (red dashed). Also shown (in green) are the distributions normalised to the same number of days, namely that in the PMOD record.
Current usage metrics show cumulative count of Article Views (full-text article views including HTML views, PDF and ePub downloads, according to the available data) and Abstracts Views on Vision4Press platform.
Data correspond to usage on the plateform after 2015. The current usage metrics is available 48-96 hours after online publication and is updated daily on week days.
Initial download of the metrics may take a while.