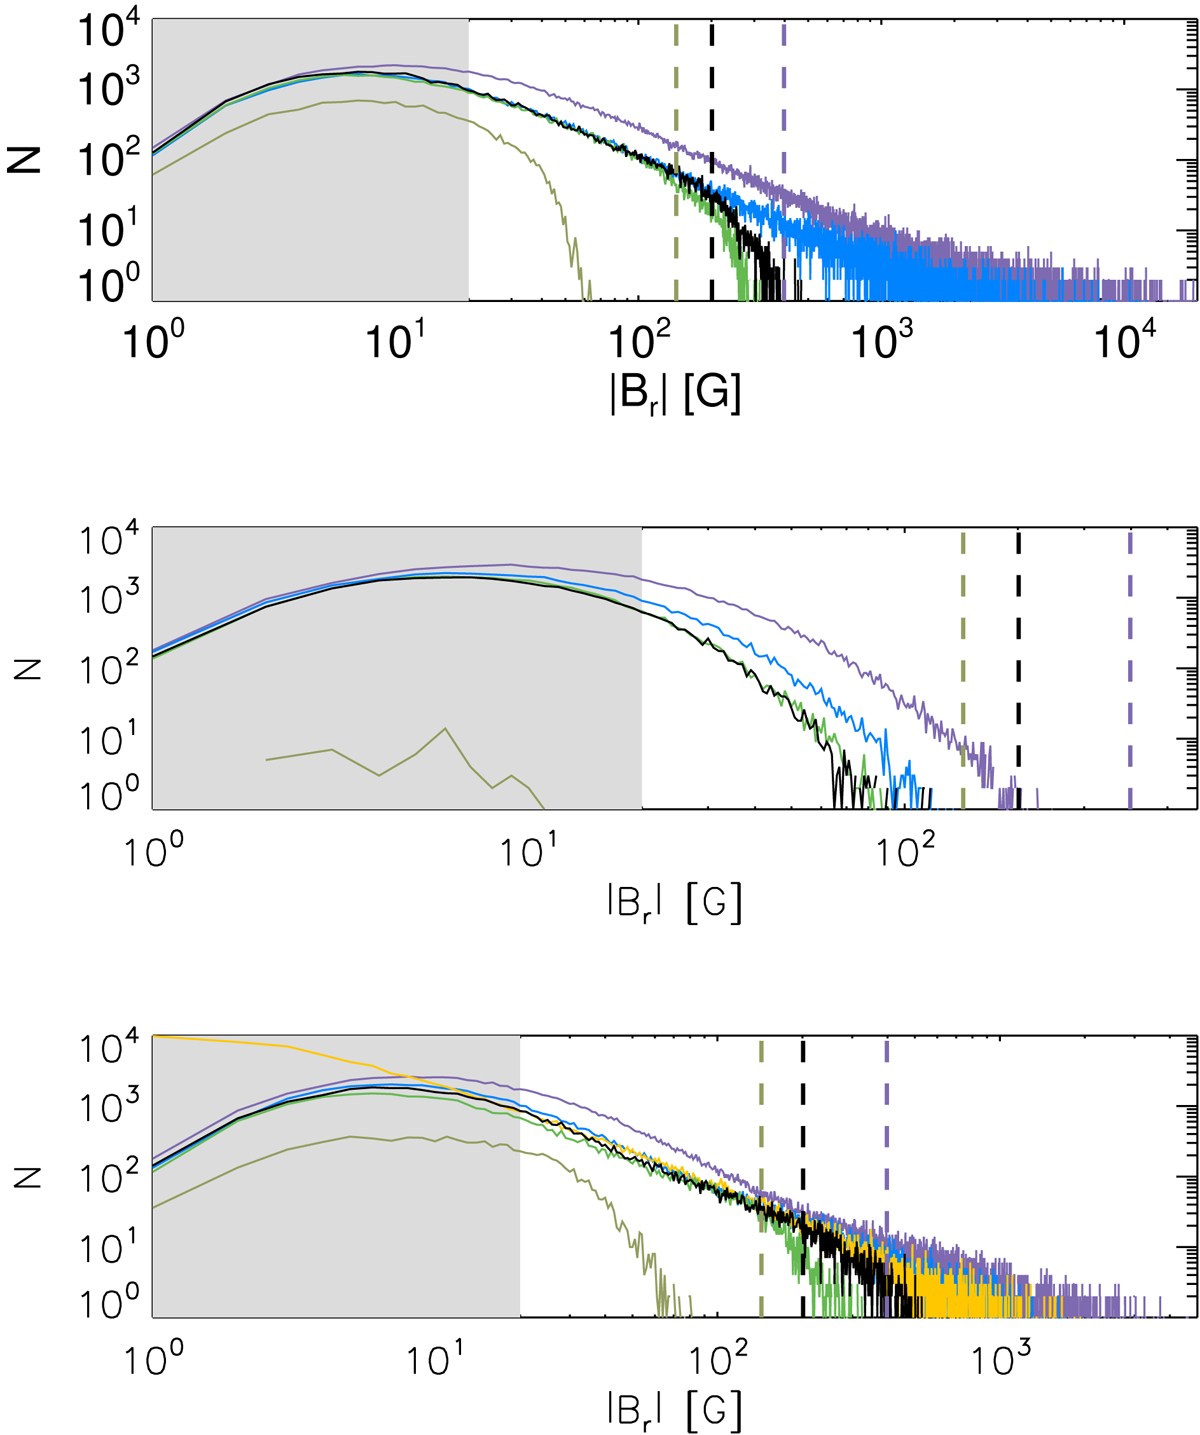
Fig. 1.
Download original image
Histograms of the unsigned radial magnetic flux density |Br| in magnetograms reconstructed from Ca II K observations taken on 11 August 2001 (top), 16 July 2009 (middle), and 10 May 2012 (bottom). The observations used are from RP (black), MD1 (blue/purple for reconstructions with/without the normalisation of the contrast values to RP, see Sect. 3), SF (dark/light green for reconstructions with/without the normalisation), and SDO/HMI (orange, shown only in the bottom panel as these data are not available prior to 2010) archives. The histograms are produced for bins of 1 G. The vertical dashed lines mark the adopted Bsat value for each archive when using PMOD TSI as the reference, while the grey shaded surface denotes the 3-σ noise level (∼20 G) of the SDO/HMI magnetograms.
Current usage metrics show cumulative count of Article Views (full-text article views including HTML views, PDF and ePub downloads, according to the available data) and Abstracts Views on Vision4Press platform.
Data correspond to usage on the plateform after 2015. The current usage metrics is available 48-96 hours after online publication and is updated daily on week days.
Initial download of the metrics may take a while.