Free Access
Fig. 6.
Download original image
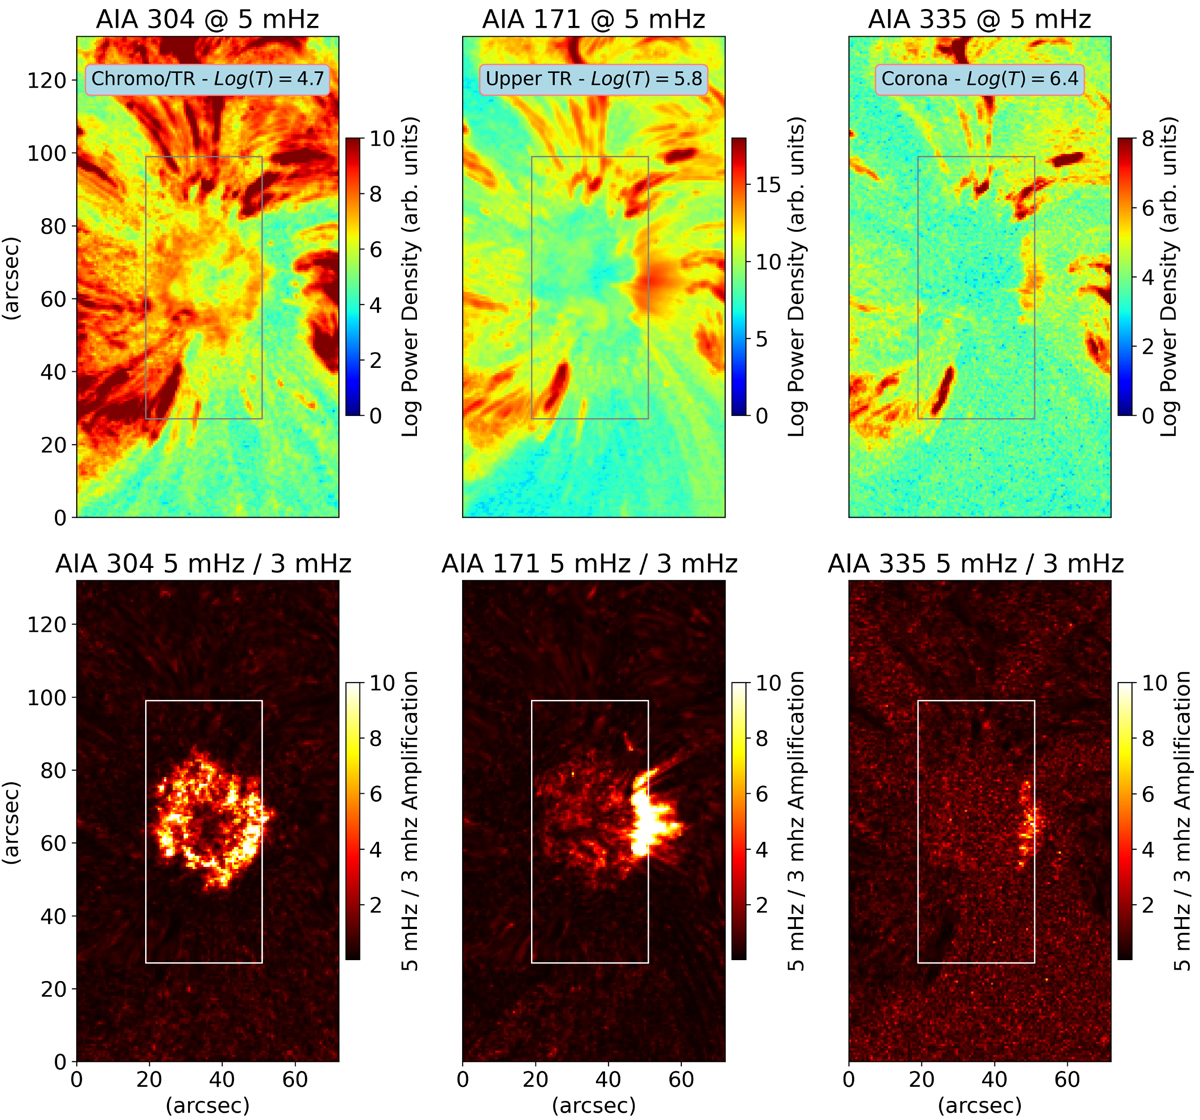
Acoustic power in the 5 mHz band (1 mHz width) for the three AIA channels spanning from the upper chromosphere to the lower corona (top row). Maps of 5 mHz to 3 mHz power ratio for the three AIA channels (bottom row). The box in all panels indicates the IBIS FOV.
Current usage metrics show cumulative count of Article Views (full-text article views including HTML views, PDF and ePub downloads, according to the available data) and Abstracts Views on Vision4Press platform.
Data correspond to usage on the plateform after 2015. The current usage metrics is available 48-96 hours after online publication and is updated daily on week days.
Initial download of the metrics may take a while.