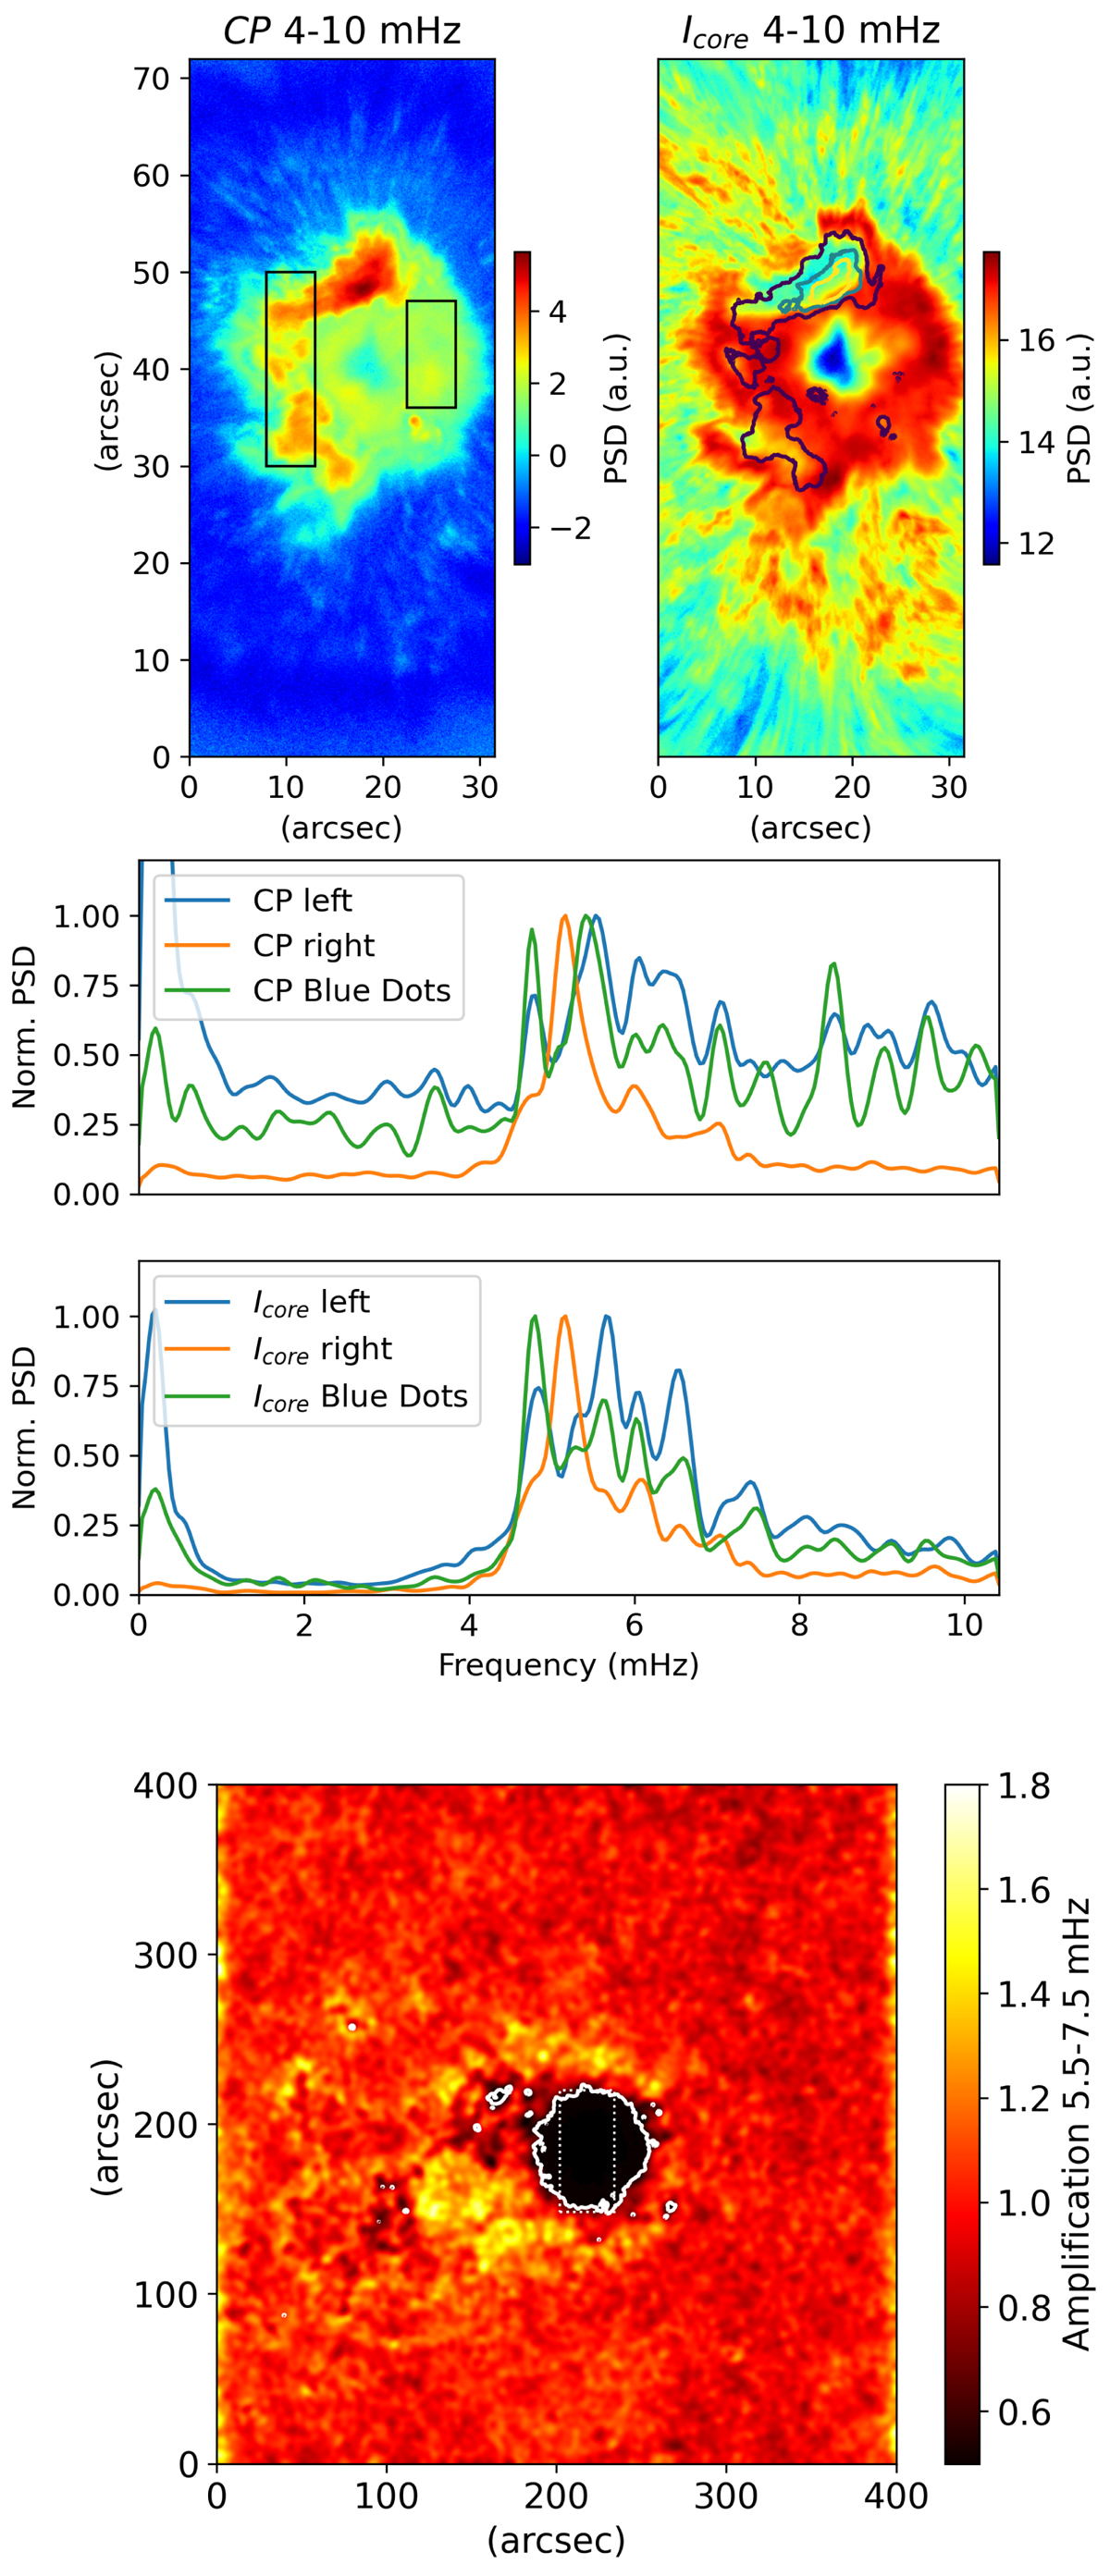
Fig. 5.
Download original image
Chromospheric IBIS CP (upper left) and Icore (upper right) power maps within the 4 − 10 mHz range. The two boxes on the CP map indicate where spectral averaging has been performed to derive the results shown in the middle panels. The black contour on the Icore map represents the CP power contour where strong magnetic wave power is detected. Plots of the CP (middle top) and Icore (middle bottom) wave power averaged across the two boxes drawn in the upper left panel. For completeness, also shown are the spectral averaging for the blue dot locations (green plots). The SDO/HMI velocity 5.5 − 7.5 mHz amplification map with respect to the quiet sun velocity power is displayed in the lower panel. The contour represents the penumbra boundary. The dotted white box on the SDO/HMI velocity amplification map (for 5.5 − 7.5 mHz) indicates the IBIS FOV.
Current usage metrics show cumulative count of Article Views (full-text article views including HTML views, PDF and ePub downloads, according to the available data) and Abstracts Views on Vision4Press platform.
Data correspond to usage on the plateform after 2015. The current usage metrics is available 48-96 hours after online publication and is updated daily on week days.
Initial download of the metrics may take a while.