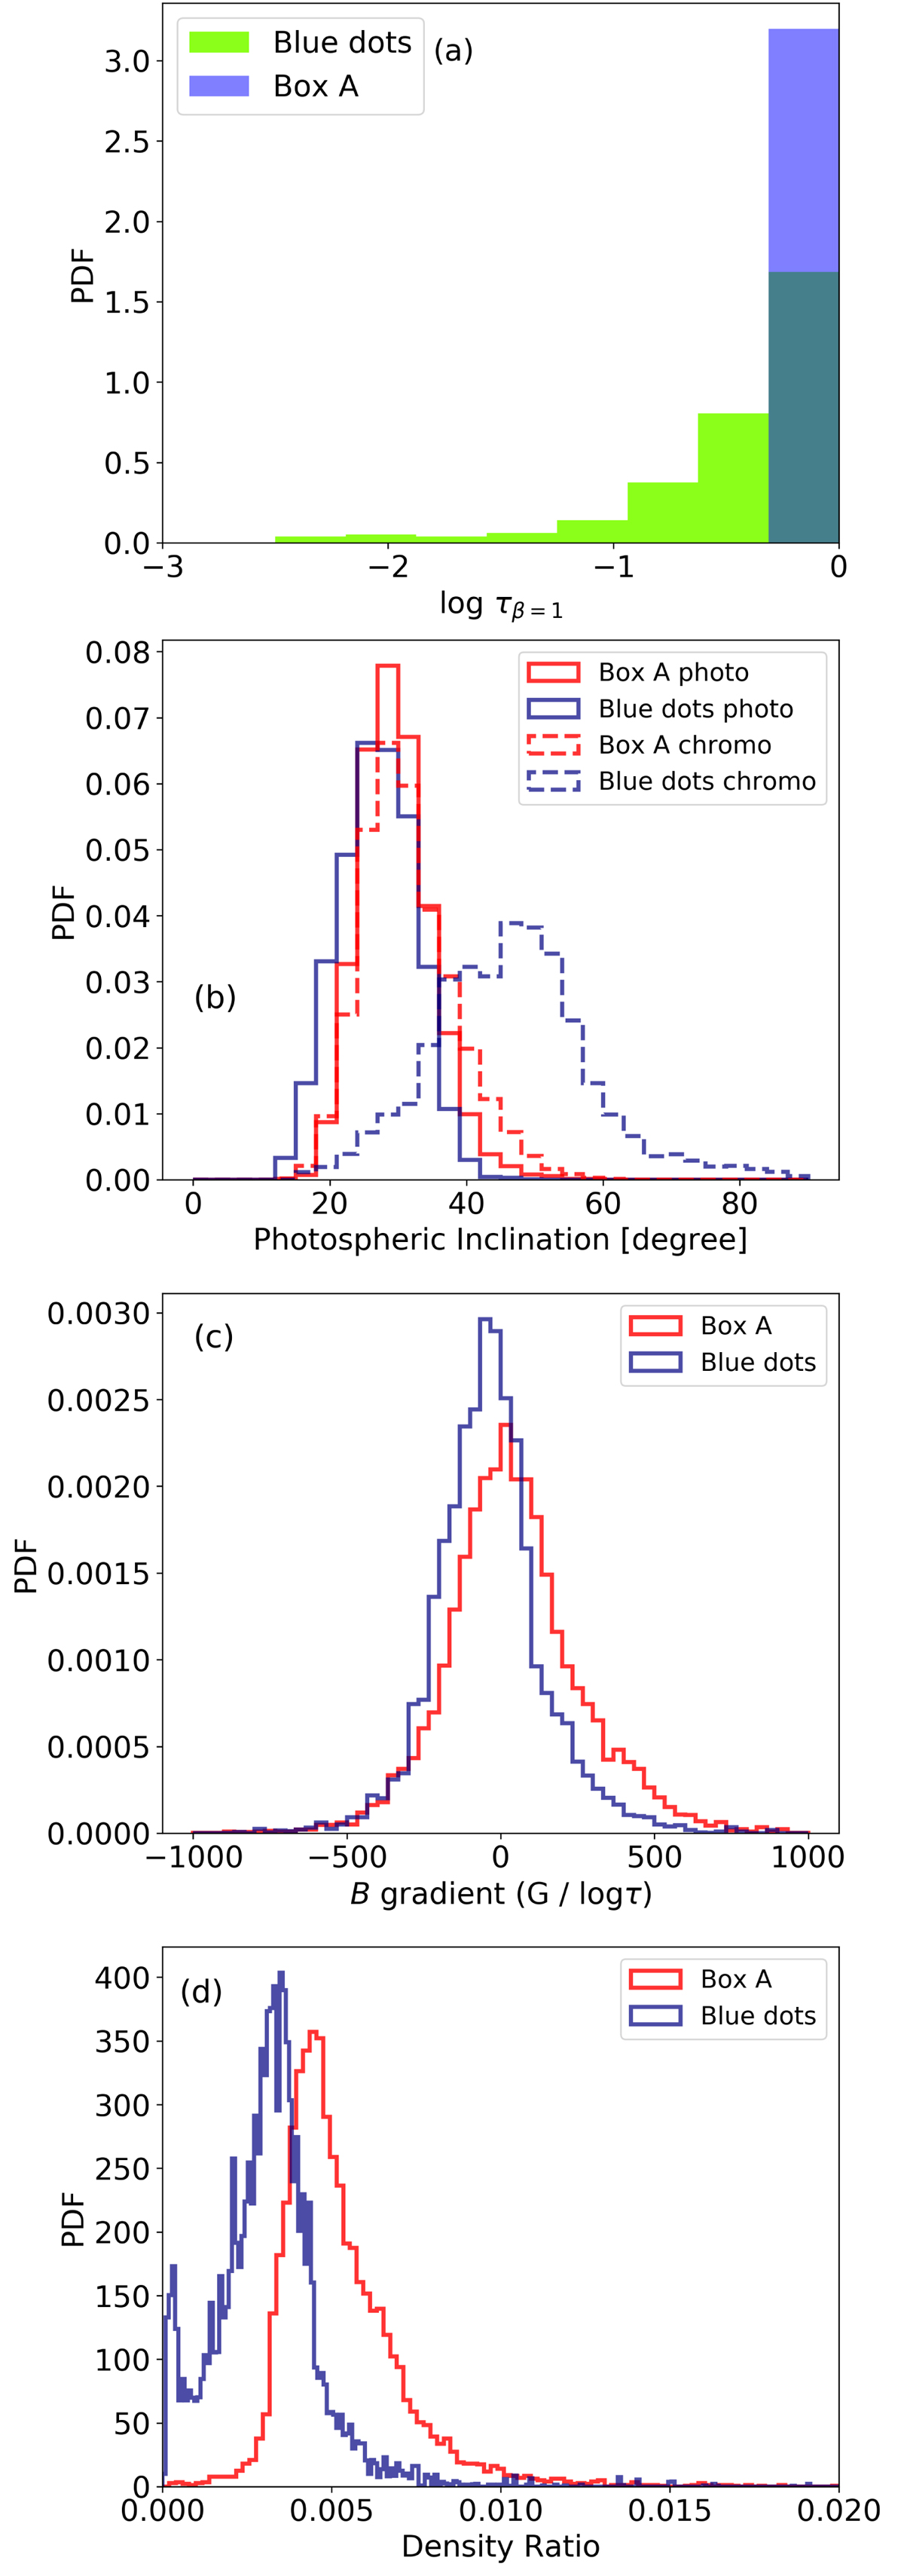
Fig. 4.
Download original image
Panel a: PDF of the optical depths, log10(τ), corresponding to the equipartition layer (vA = cs) associated with the locations of the blue dots and the area inside box A shown in Fig. 1f. Panel b: PDFs of the magnetic field inclination angles at photospheric (log10(τ) = − 1.0, red and blue histograms) and chromospheric (log10(τ) = − 4.6; dashed histograms) heights. Panels c and d: PDF distribution of the magnetic field gradient and density ratio for the selected region (i.e., the blue dots and box A).
Current usage metrics show cumulative count of Article Views (full-text article views including HTML views, PDF and ePub downloads, according to the available data) and Abstracts Views on Vision4Press platform.
Data correspond to usage on the plateform after 2015. The current usage metrics is available 48-96 hours after online publication and is updated daily on week days.
Initial download of the metrics may take a while.