Fig. 3.
Download original image
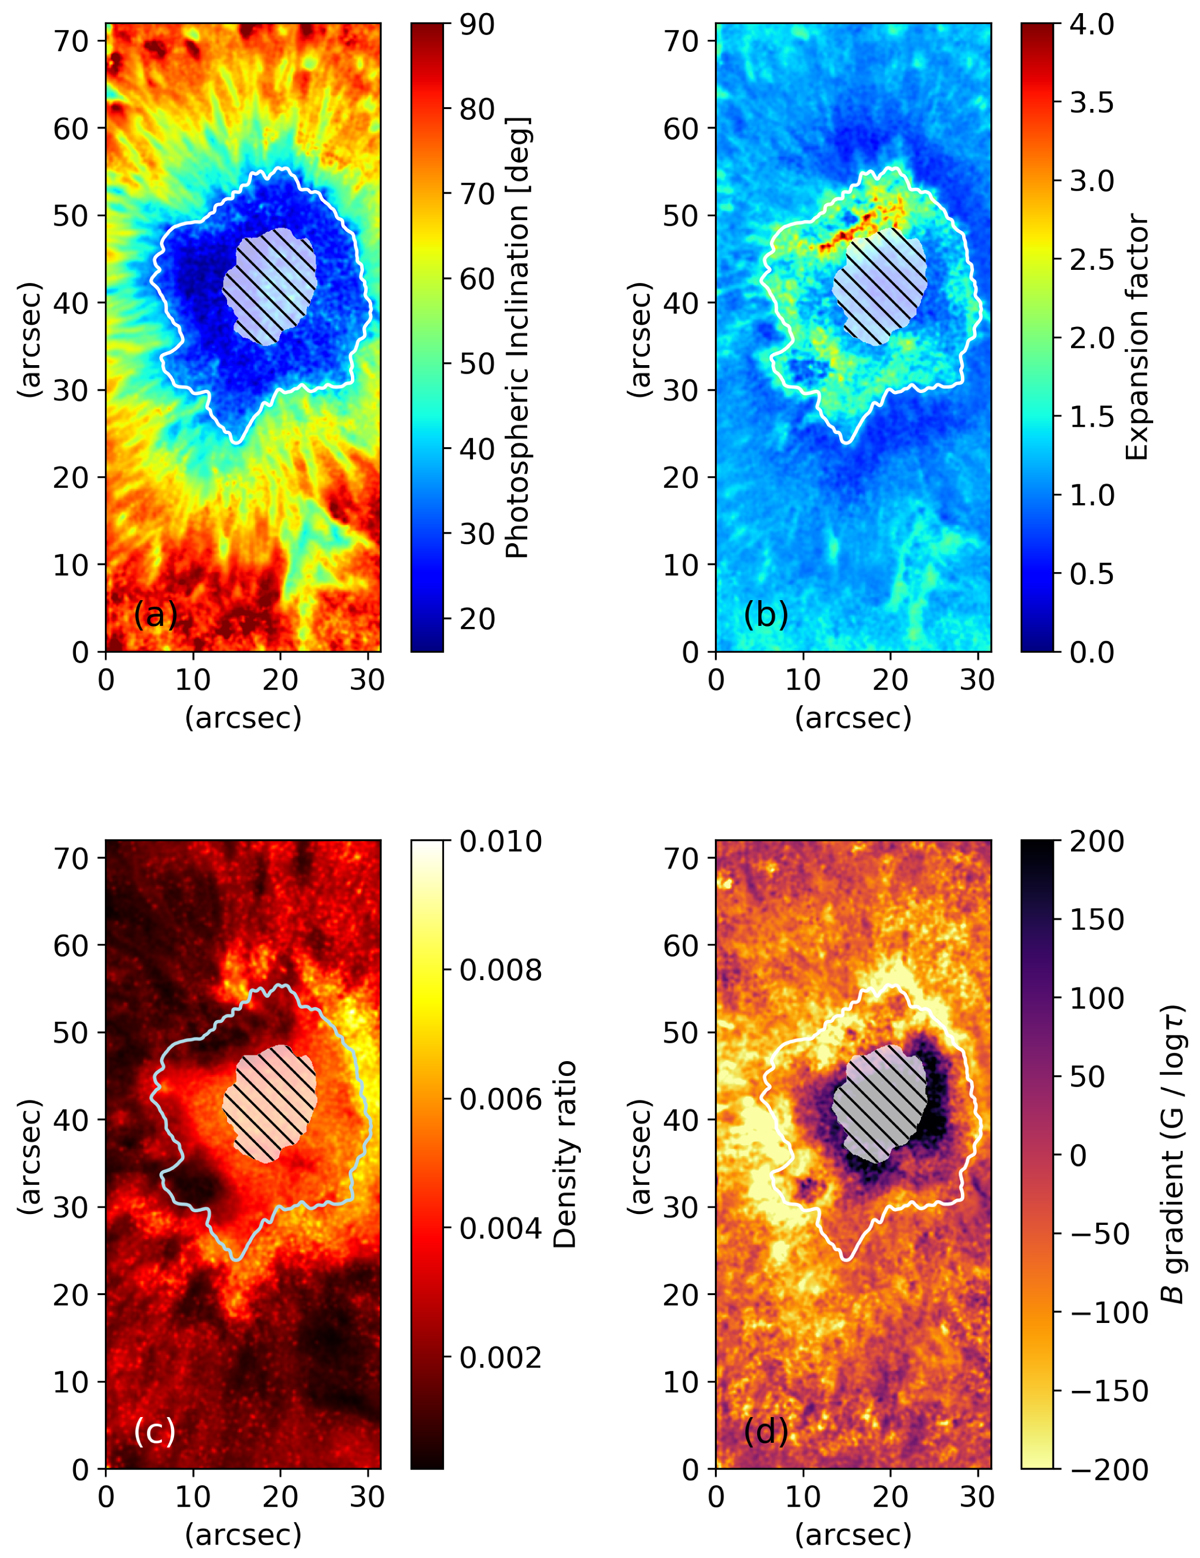
Inclination angle of the magnetic field at log10(τ) = − 1.0 (photosphere; panel a). Expansion factor of the magnetic field between photosphere and chromosphere (i.e., at log10(τ) = − 4.6) (panel b). Density ratio between chromosphere and photosphere (panel c). Total magnetic field gradient (panel d). The white contour in four panels represents the umbra-penumbra boundary as seen in the continuum intensity. The hatched area indicates the central region of the umbra where saturation effects and low photon flux are detected in the photosphere (Stangalini et al. 2018). The magnetic field, the inclination angles, and the density ratios were derived from the NICOLE inversions.
Current usage metrics show cumulative count of Article Views (full-text article views including HTML views, PDF and ePub downloads, according to the available data) and Abstracts Views on Vision4Press platform.
Data correspond to usage on the plateform after 2015. The current usage metrics is available 48-96 hours after online publication and is updated daily on week days.
Initial download of the metrics may take a while.