Fig. 2.
Download original image
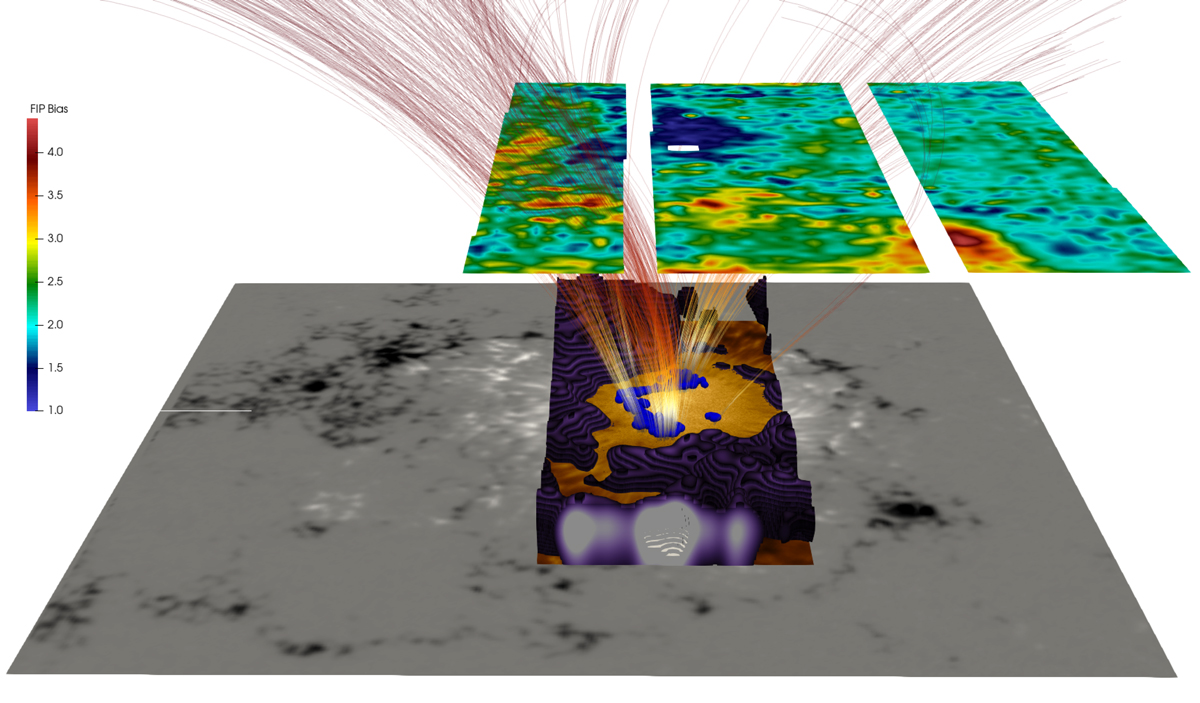
Three-dimensional view of the AR 12546. From bottom to top: SDO/HMI magnetogram, IBIS Fe I core with blue dots overplotted, and Hinode/EIS FIP bias map. The purple surface represents the equipartition layer (0.8 < cs/vA < 1.2) as inferred from the spectropolarimetric inversions. Selected field lines from a PFSS extrapolation of the coronal field link the blue dots with regions of high-FIP bias on the eastern and southern edges of the sunspot (i.e., in the penumbra; see Baker et al. 2021 for more details).
Current usage metrics show cumulative count of Article Views (full-text article views including HTML views, PDF and ePub downloads, according to the available data) and Abstracts Views on Vision4Press platform.
Data correspond to usage on the plateform after 2015. The current usage metrics is available 48-96 hours after online publication and is updated daily on week days.
Initial download of the metrics may take a while.