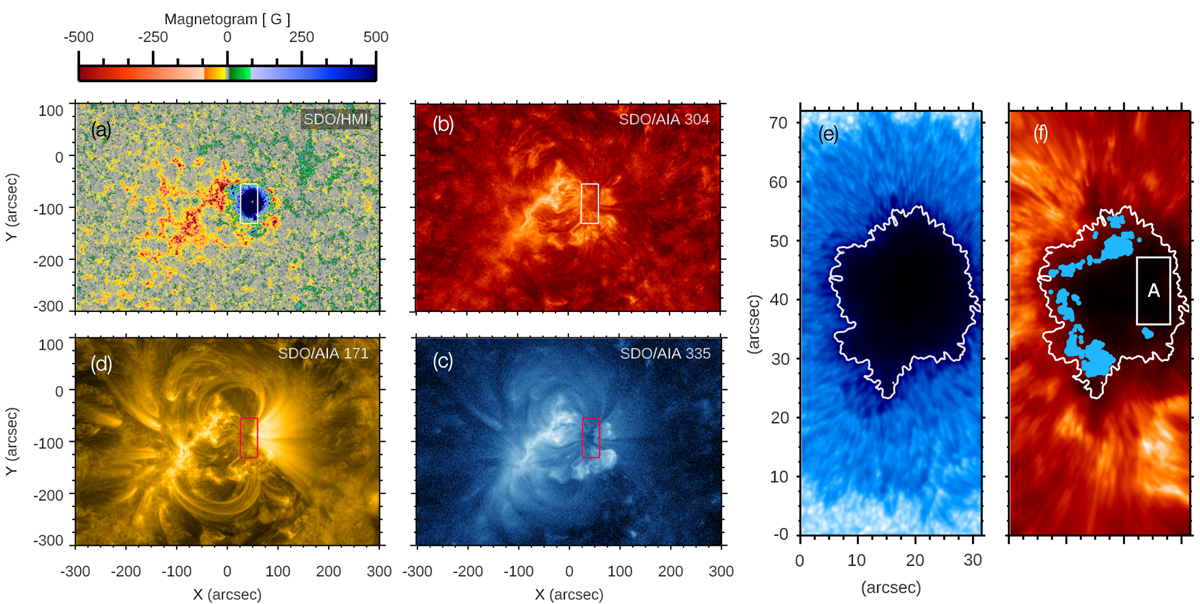
Fig. 1.
Download original image
SDO/HMI magnetogram (panel a) and SDO/AIA 304 Å (panel b), 171 Å (panel d), and 335 Å (panel c) filtergrams at the time of the IBIS observations at 14:00 UT on 2016 May 20. The white and red boxes in panels a–d indicate the IBIS FOV shown in the right panels. The HMI magnetogram is saturated at ±500 G for better visibility. Panels e and f show a photospheric continuum intensity map derived from the Fe I 617.3 nm line and a chromospheric Ca II 854.2 nm line core intensity map, respectively. The white contours represent the umbra-penumbra boundary derived from the continuum intensity. The blue dots indicate the locations where magnetic perturbations are detected (Stangalini et al. 2021). Box ‘A’ in the chromospheric Ca II 854.2 nm line core image (panel f) indicates where the probability density functions shown in Fig. 4 have been computed. A movie of HMI magnetograms is available in the online material.
Current usage metrics show cumulative count of Article Views (full-text article views including HTML views, PDF and ePub downloads, according to the available data) and Abstracts Views on Vision4Press platform.
Data correspond to usage on the plateform after 2015. The current usage metrics is available 48-96 hours after online publication and is updated daily on week days.
Initial download of the metrics may take a while.