Open Access
Fig. A.1.
Download original image
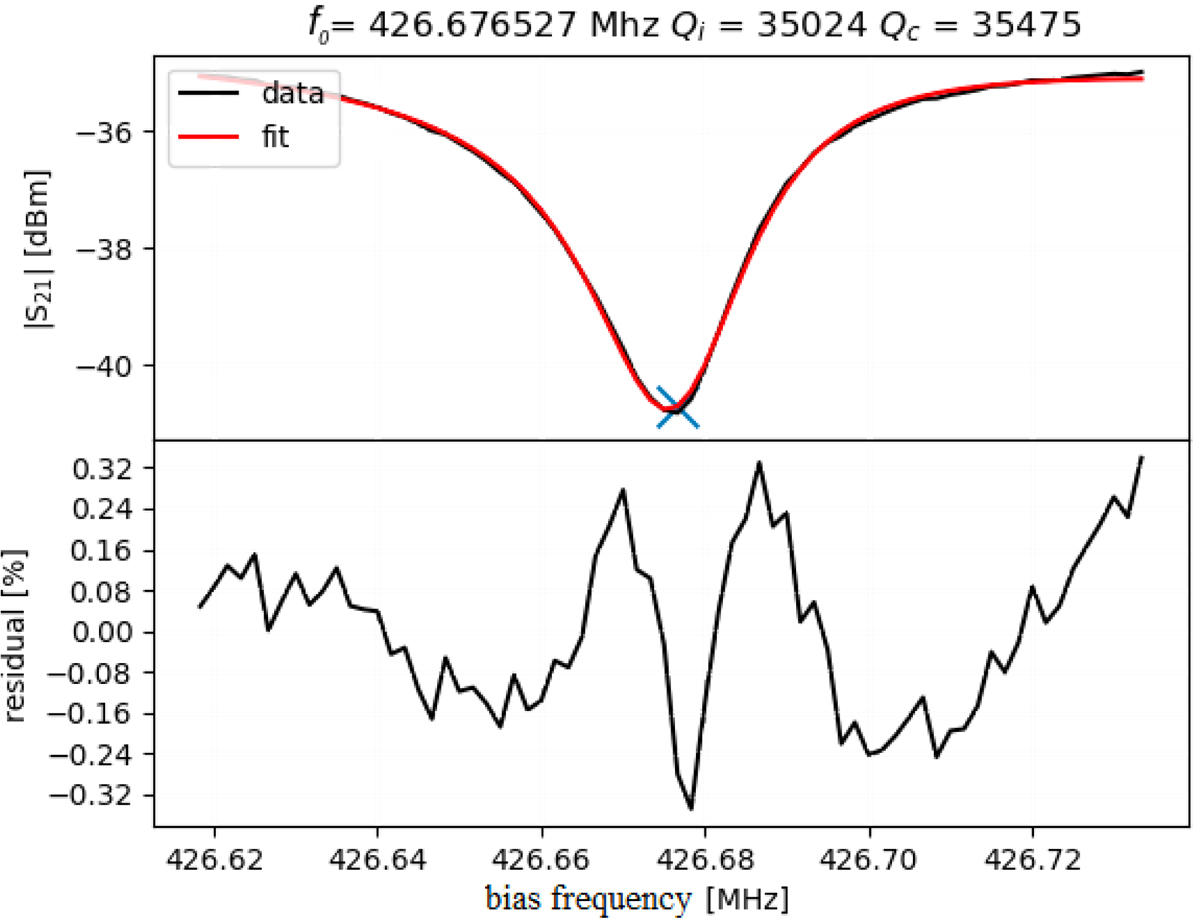
Amplitude signal, |S21(f)|, as a function of the bias frequency, f. The resonance curve is fitted to characterize the pixel. Top: Single pixel bias signal (in black) and fitting Eq. A.3 (in red). The blue cross identifies the resonance frequency. Bottom: Percentage residual of a good fit between data and model.
Current usage metrics show cumulative count of Article Views (full-text article views including HTML views, PDF and ePub downloads, according to the available data) and Abstracts Views on Vision4Press platform.
Data correspond to usage on the plateform after 2015. The current usage metrics is available 48-96 hours after online publication and is updated daily on week days.
Initial download of the metrics may take a while.