Open Access
Fig. 8.
Download original image
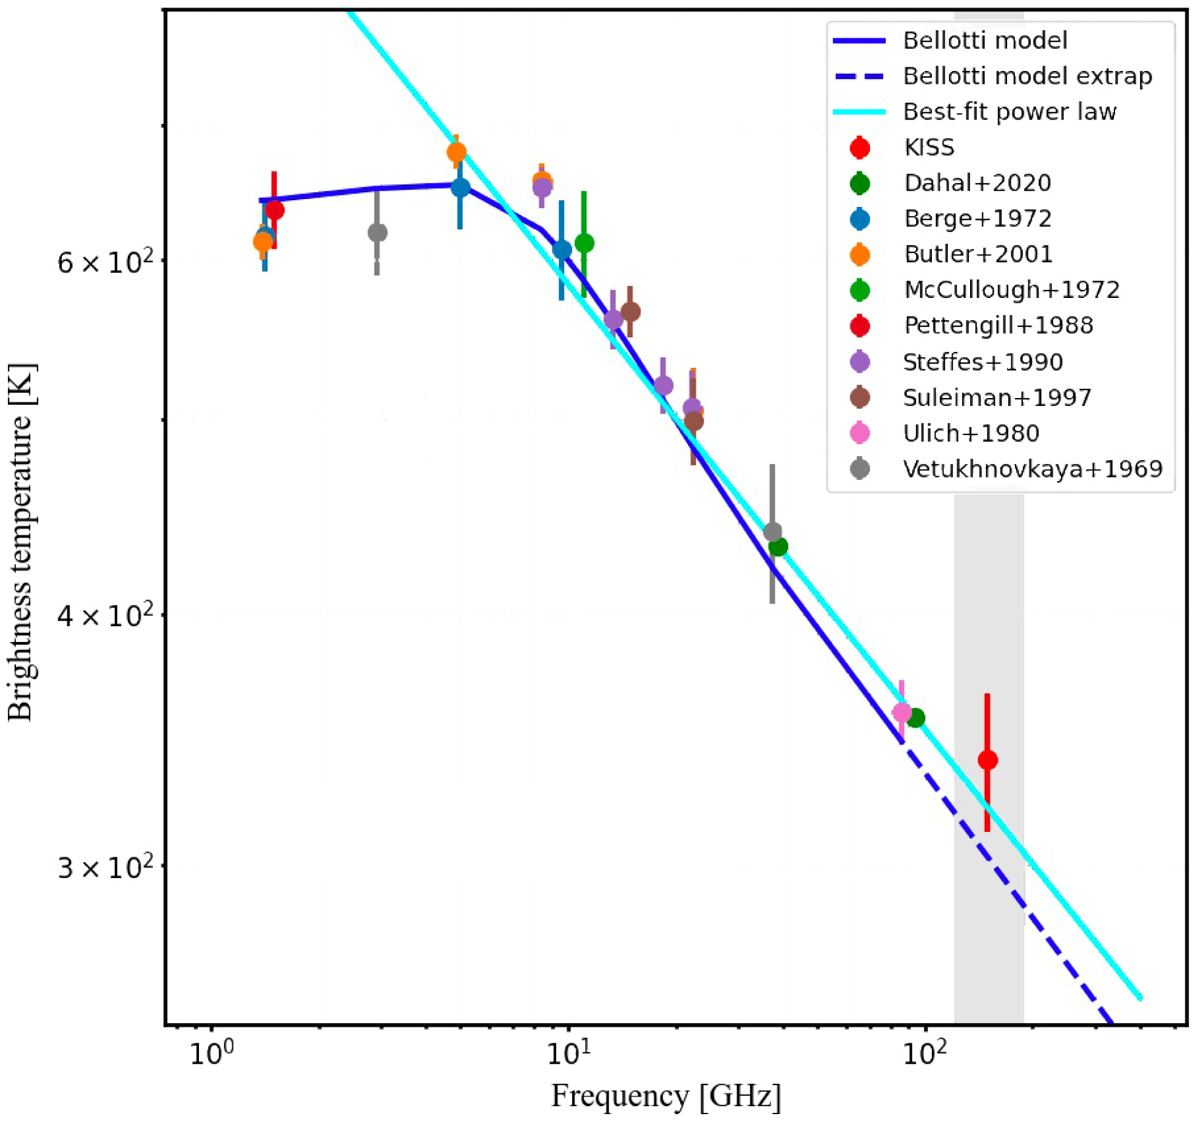
Venus brightness temperature as a function of frequency. We present a collection of radio and mm wavelength measurements including those of KISS. The blue solid line identifies the Bellotti (2015) model and the dashed one represents its power-law extrapolation. The cyan solid line identifies a single power-law.
Current usage metrics show cumulative count of Article Views (full-text article views including HTML views, PDF and ePub downloads, according to the available data) and Abstracts Views on Vision4Press platform.
Data correspond to usage on the plateform after 2015. The current usage metrics is available 48-96 hours after online publication and is updated daily on week days.
Initial download of the metrics may take a while.