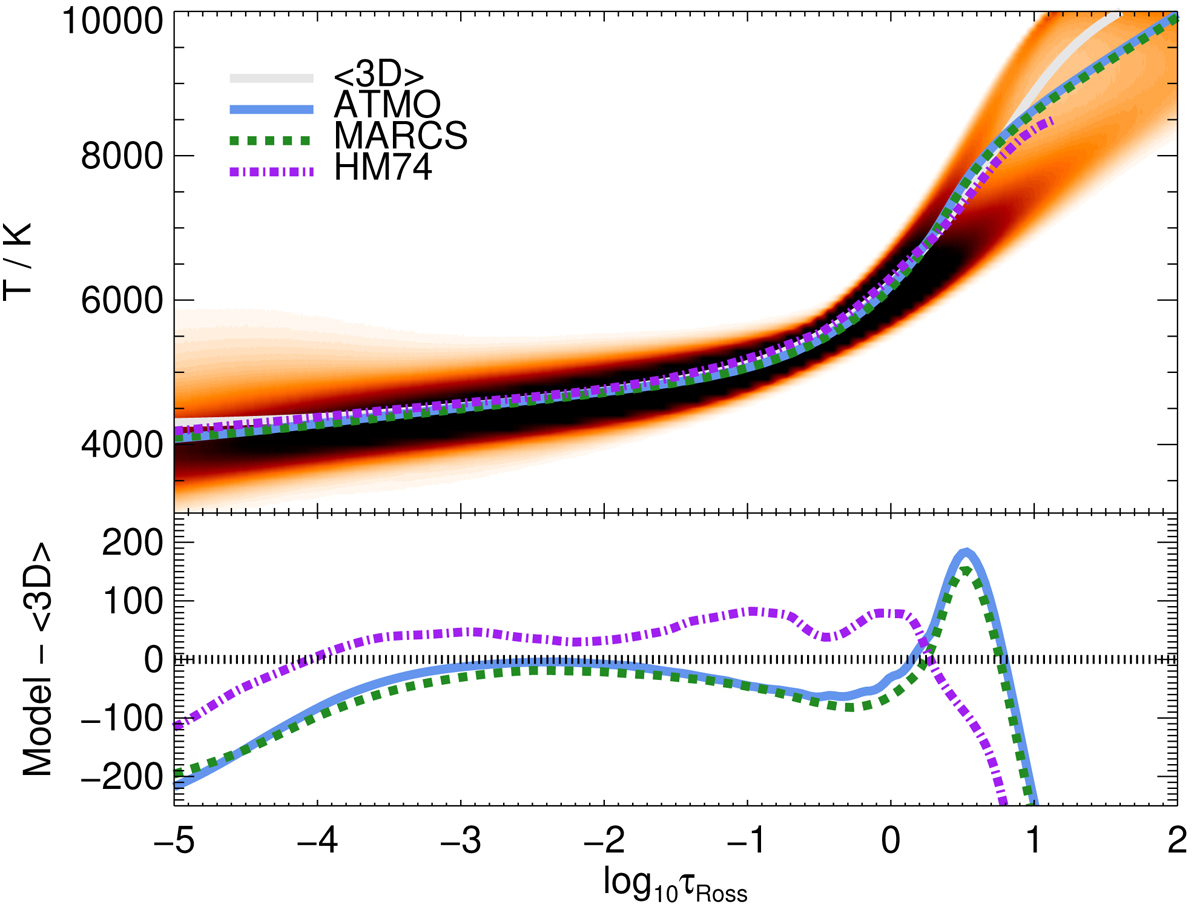
Fig. 2.
Download original image
Distribution of temperature and Rosseland mean vertical optical depth for the 3D radiative-hydrodynamical model atmosphere, with darker colours indicating larger densities of grid points. The structures of the 1D model atmospheres used in this work are overplotted. Bottom panel: difference in temperature of the 1D models with respect to the horizontally and temporally averaged ⟨3D⟩ model.
Current usage metrics show cumulative count of Article Views (full-text article views including HTML views, PDF and ePub downloads, according to the available data) and Abstracts Views on Vision4Press platform.
Data correspond to usage on the plateform after 2015. The current usage metrics is available 48-96 hours after online publication and is updated daily on week days.
Initial download of the metrics may take a while.