Fig. 1.
Download original image
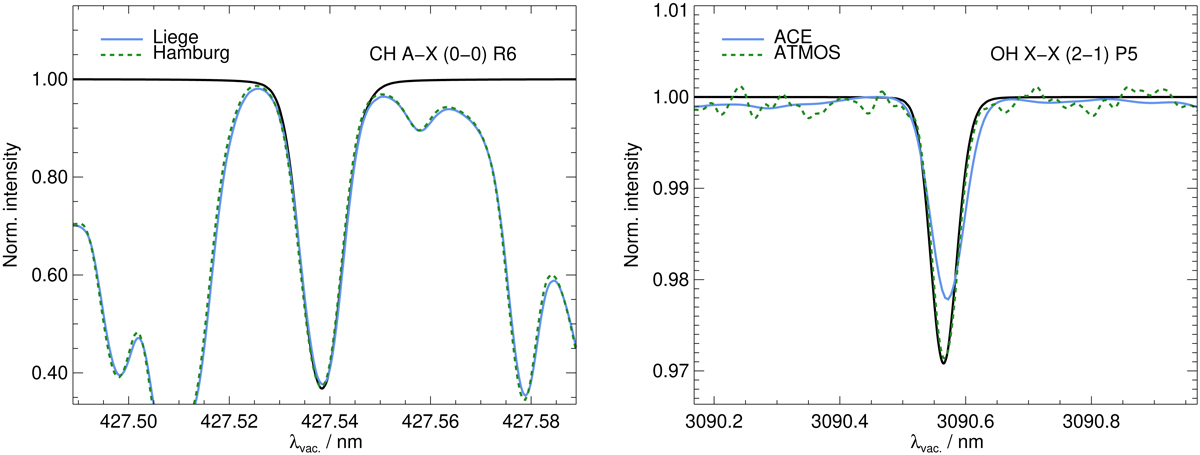
Illustrative example optical and infrared spectra from the 3D model compared to different solar atlases. The theoretical line strengths have not been fitted to the data; rather, the input abundance is based on interpolating the theoretical equivalent width to the mean one measured in both atlases. No instrumental broadening has been applied, and thus in the infrared the ACE profiles are seen to be broader and shallower than both the ATMOS and theoretical ones.
Current usage metrics show cumulative count of Article Views (full-text article views including HTML views, PDF and ePub downloads, according to the available data) and Abstracts Views on Vision4Press platform.
Data correspond to usage on the plateform after 2015. The current usage metrics is available 48-96 hours after online publication and is updated daily on week days.
Initial download of the metrics may take a while.