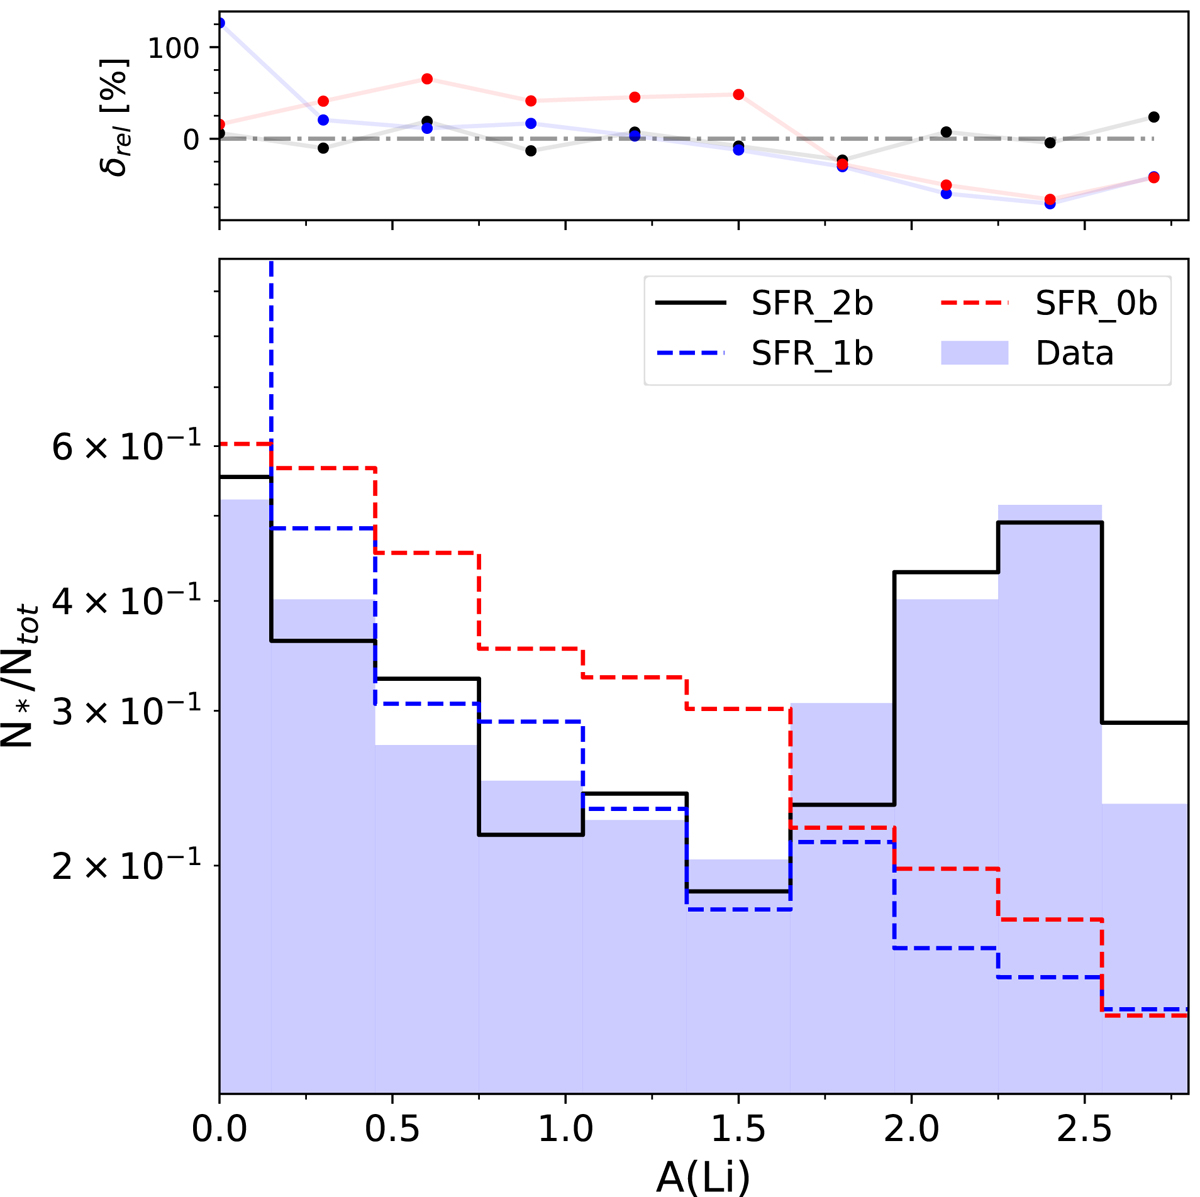
Fig. 8.
Download original image
Normalised A(Li) histogram of all stars in our data sample (soft blue colour bars) vs. predictions by our GCE models (solid and dashed lines), and relative errors (top panel). Dashed red lines show the results from our SFR_0b model, dashed blue lines from SFR_1b, and solid black lines from the SFR_2b model, which is the one that best reproduces the observed A(Li) distribution (see Sect. 3.2 for more information on the models). Bin numbers in all histograms have been obtained by applying the Freedman-Diaconis rule (Diaconis & Freedman 2004).
Current usage metrics show cumulative count of Article Views (full-text article views including HTML views, PDF and ePub downloads, according to the available data) and Abstracts Views on Vision4Press platform.
Data correspond to usage on the plateform after 2015. The current usage metrics is available 48-96 hours after online publication and is updated daily on week days.
Initial download of the metrics may take a while.