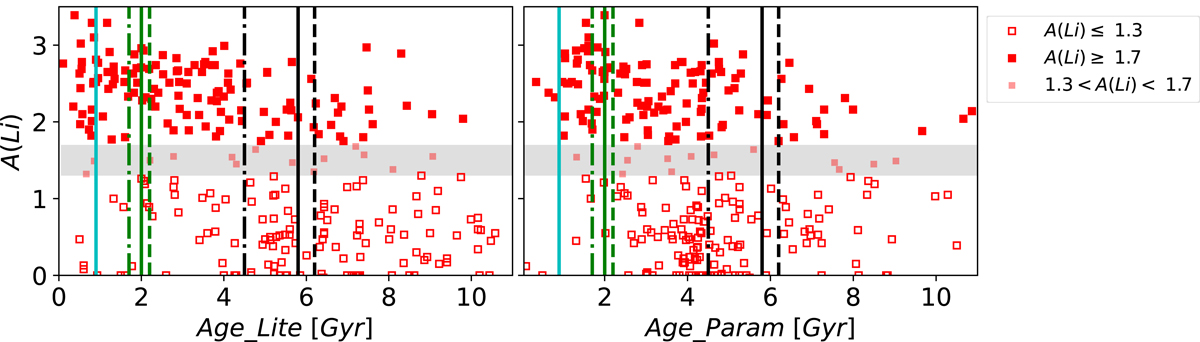
Fig. 5.
Download original image
A(Li) vs. the two age scales used in this work (see Sect. 2) for stars with planets (Y). Left panel: age from the literature (Age_Lite). Right panel: age from isochrones (Age_Param). The vertical lines represent the main galactic events known to happen in that temporal range (Sagittarius dwarf pericentres and the star formation burst presented in Mor et al. 2019). Consistent with previous figures, the grey shaded region corresponds to the transition region we called the isthmus.
Current usage metrics show cumulative count of Article Views (full-text article views including HTML views, PDF and ePub downloads, according to the available data) and Abstracts Views on Vision4Press platform.
Data correspond to usage on the plateform after 2015. The current usage metrics is available 48-96 hours after online publication and is updated daily on week days.
Initial download of the metrics may take a while.