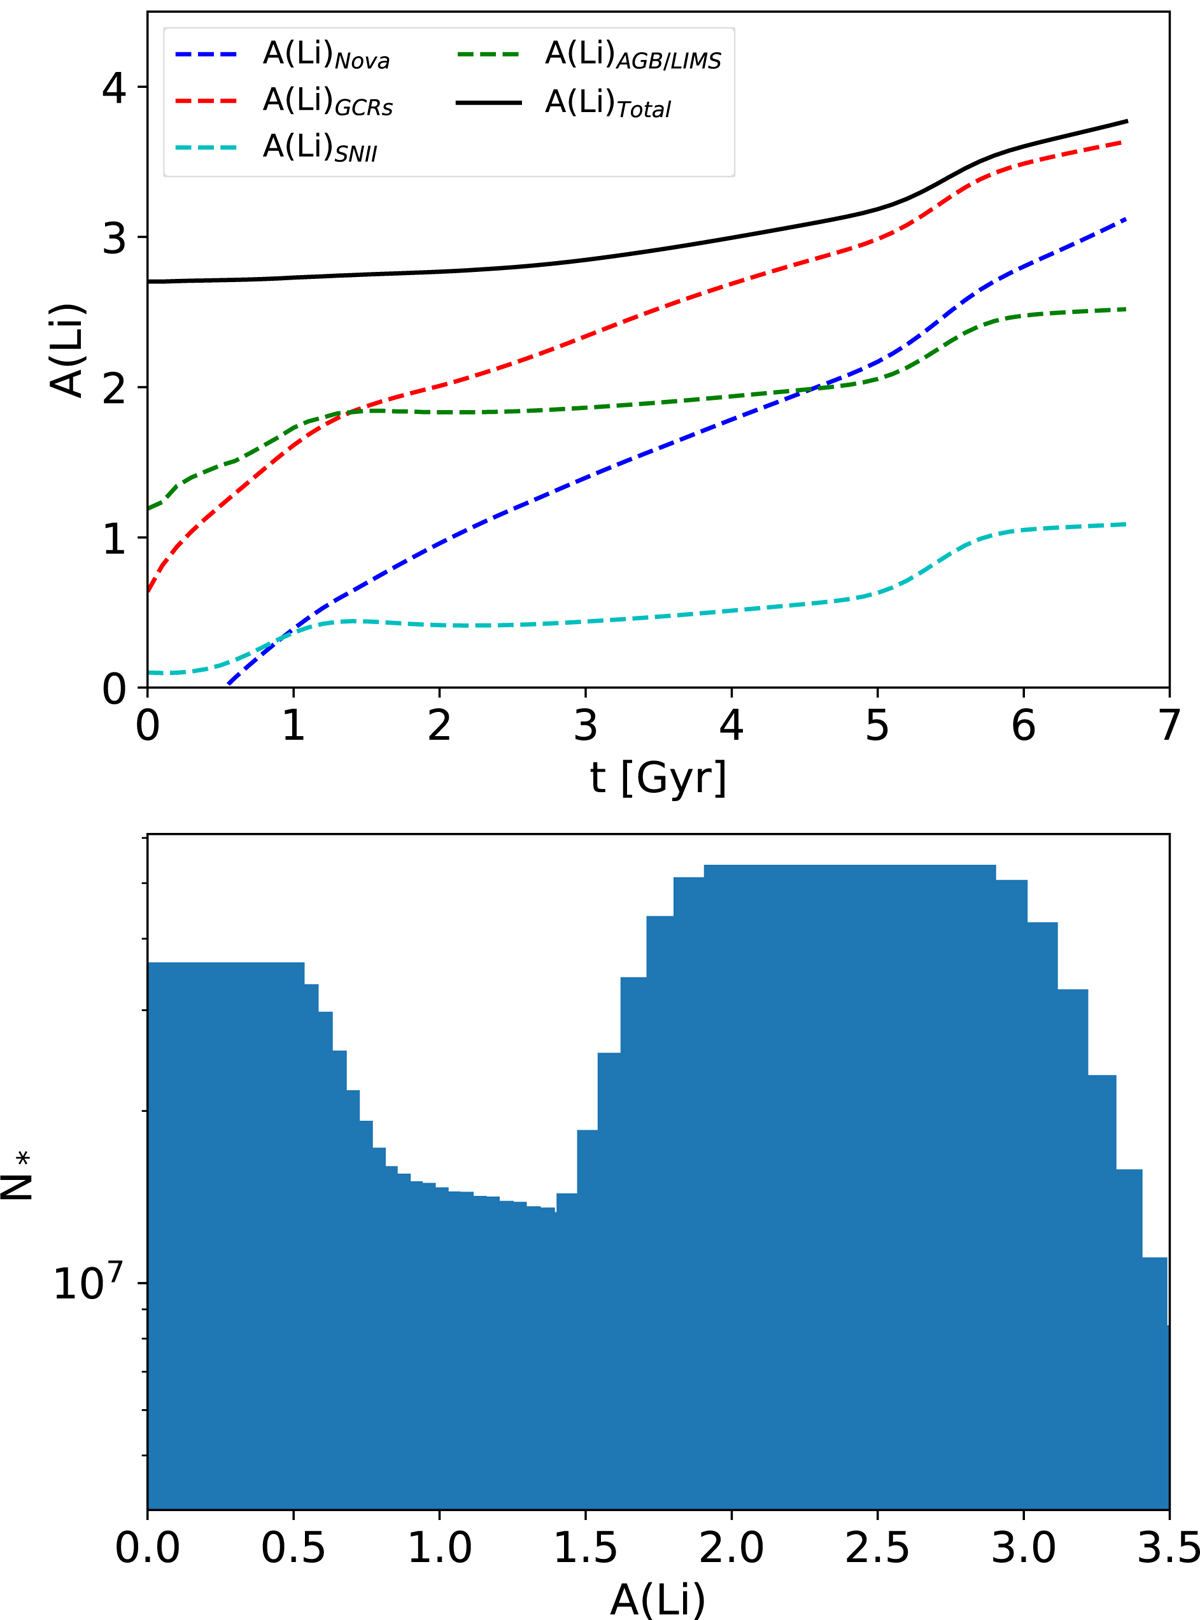
Fig. 3.
Download original image
A(Li) evolution and its distribution in the FGK MS stars, obtained using our best GCE model. Top: A(Li) evolution in our best model (SFR_b2) when not including the stellar depletion mechanisms described in Sect. 3.2. The solid black line shows the total A(Li) evolution. Dashed lines show the A(Li) computed using the lithium produced by each of the studied production mechanisms, without including the lithium mass at t = 0; in red we show the contribution of GCRs, in blue the novae, in cyan the SNeII, and in green the AGB and LIMSs. Bottom: histogram of the total number of FGK MS stars per A(Li) bin generated by our best GCE model when including all aforementioned production and depletion mechanisms. We obtained the bin size of all histograms in this work by applying the Freedman-Diaconis rule (Diaconis & Freedman 2004).
Current usage metrics show cumulative count of Article Views (full-text article views including HTML views, PDF and ePub downloads, according to the available data) and Abstracts Views on Vision4Press platform.
Data correspond to usage on the plateform after 2015. The current usage metrics is available 48-96 hours after online publication and is updated daily on week days.
Initial download of the metrics may take a while.