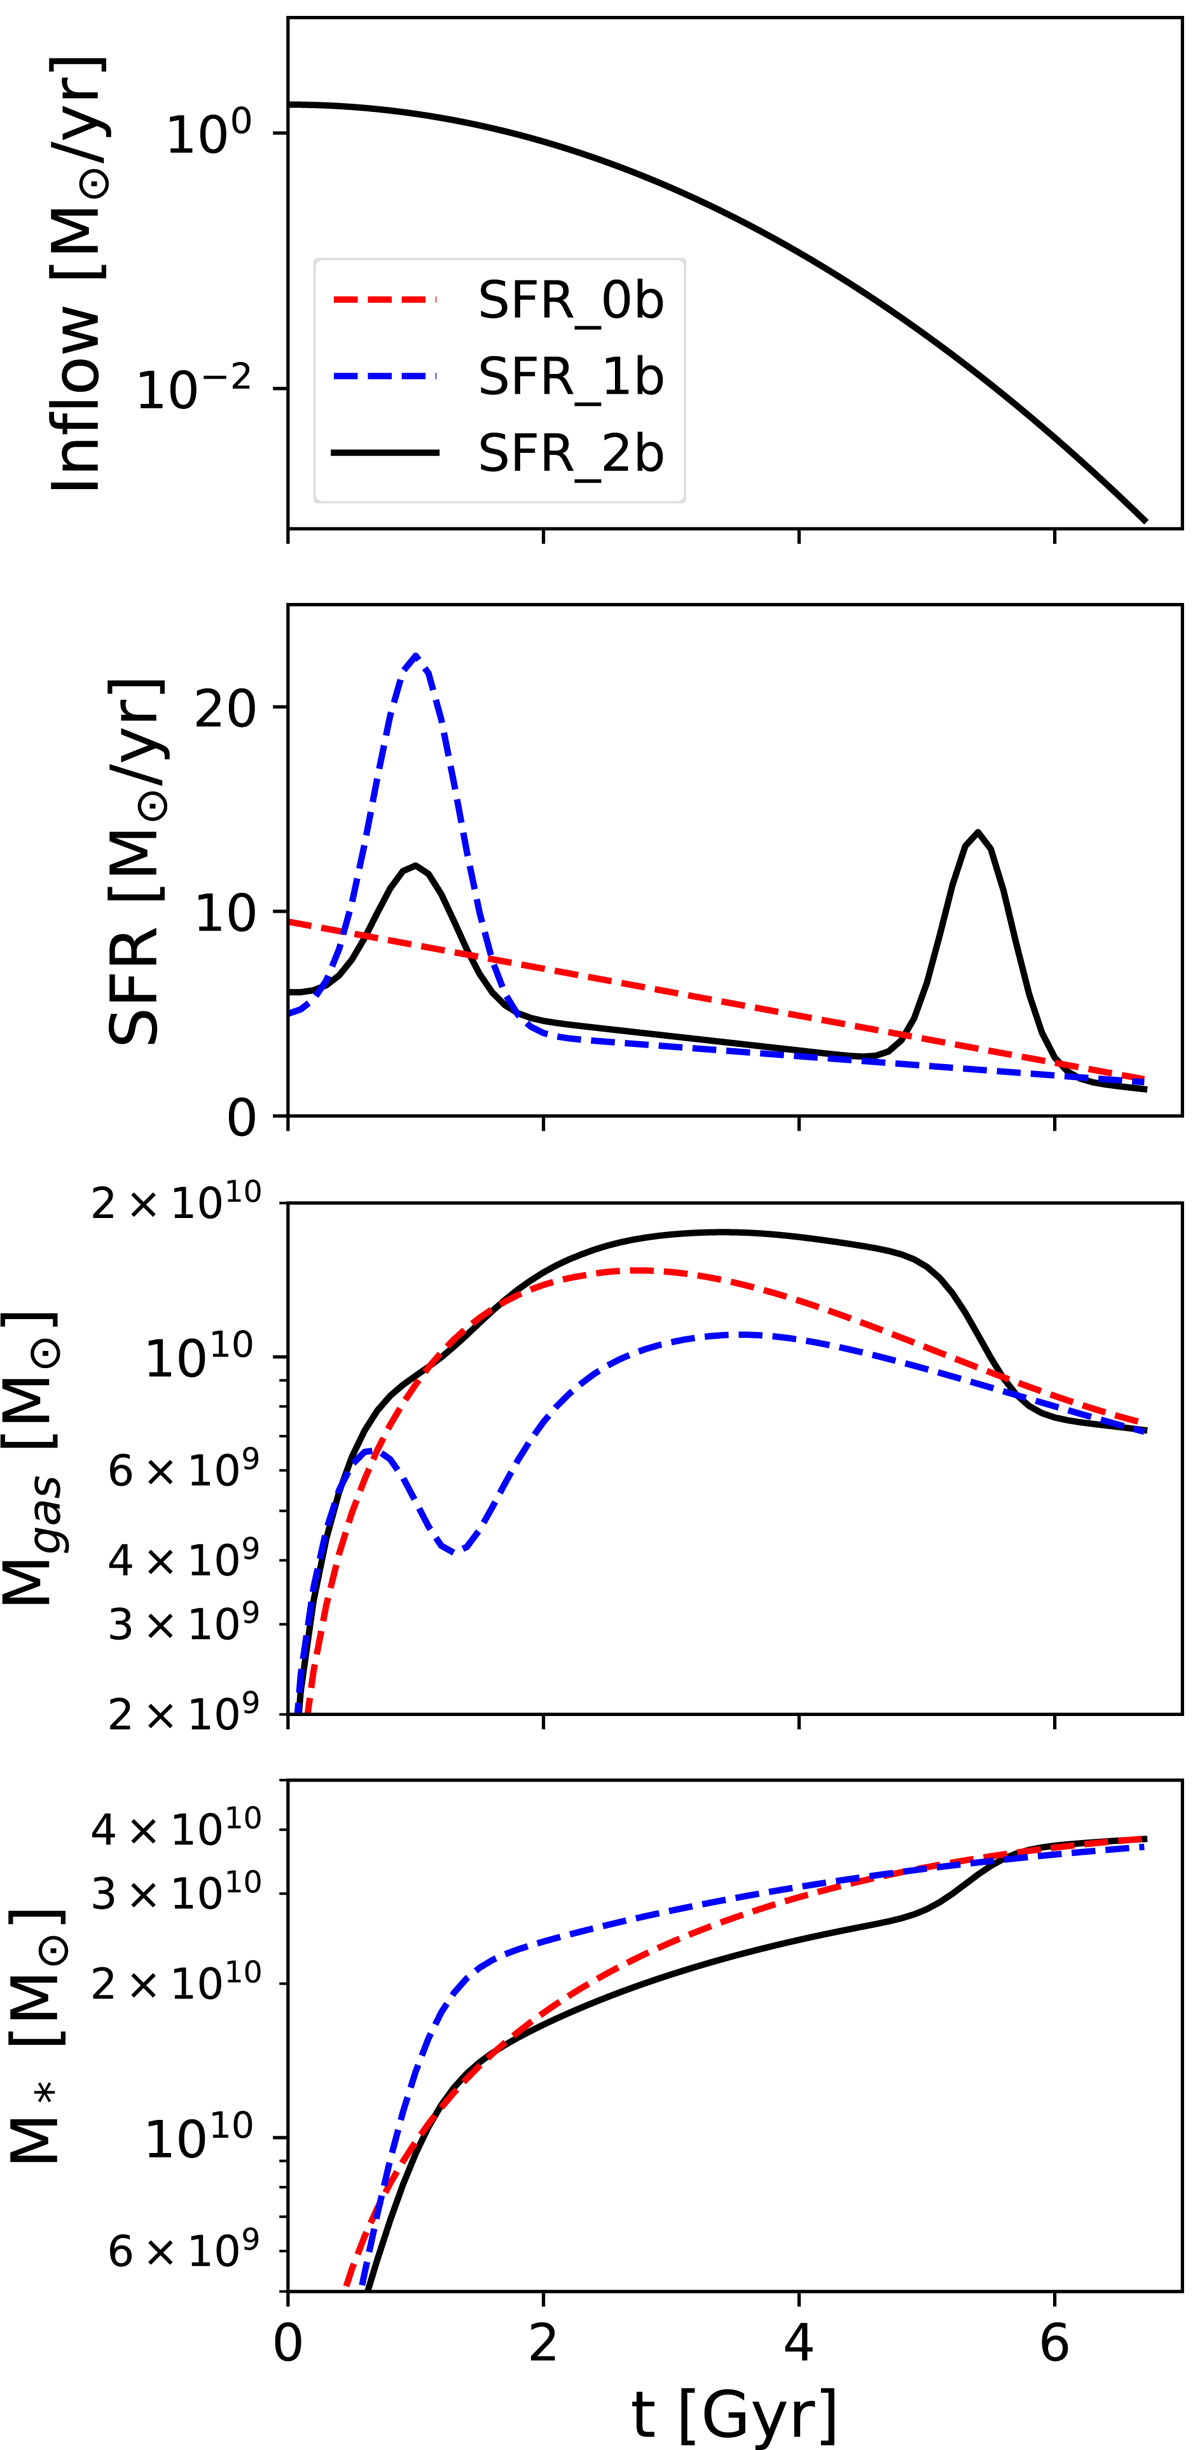
Fig. 2.
Download original image
Gas inflow and SFHs in our main models. Top: gas inflow history. Middle top: SFH. Middle bottom: evolution of the total gas mass. Bottom: stellar mass growth. In all panels solid black lines show the model that best reproduces the observed A(Li) evolution of thin-disk stars (SFR_2b), dashed blue lines show the single star formation burst model (SFR_1b), and the dashed red lines show the monotonically decreasing star formation model (SFR_0b).
Current usage metrics show cumulative count of Article Views (full-text article views including HTML views, PDF and ePub downloads, according to the available data) and Abstracts Views on Vision4Press platform.
Data correspond to usage on the plateform after 2015. The current usage metrics is available 48-96 hours after online publication and is updated daily on week days.
Initial download of the metrics may take a while.