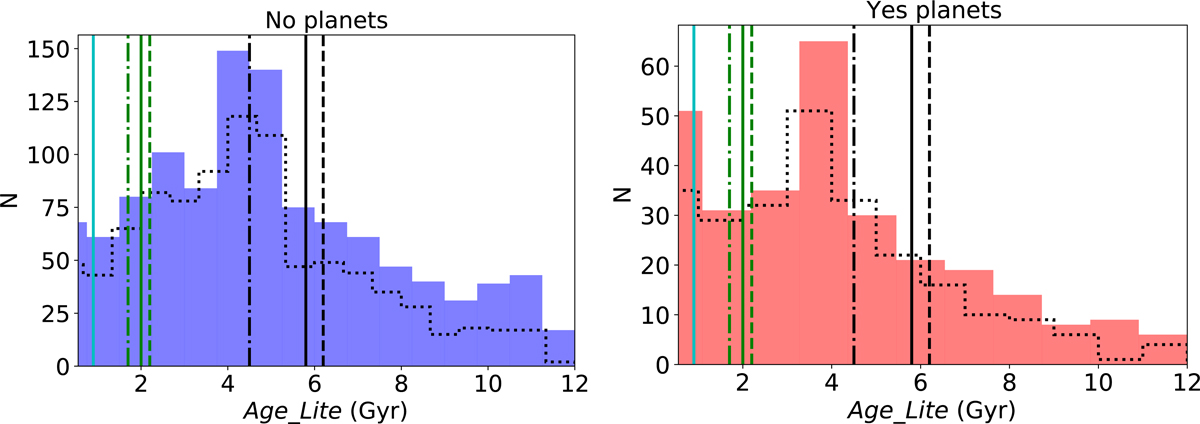
Fig. B.1.
Download original image
Age_Lite histogram for stars with (right) and without (left) planets. We show the thin disk contribution to the total with a black dotted histogram. The bin width has been obtained by applying the Freeman-Diaconis rule. Vertical lines show the start (dashed), peak (solid), and end (dot-dashed) of MW star formation bursts presented in Ruiz-Lara et al. (2020): in black, the strong star formation burst detected in Mor et al. (2019); in green, the last Sagittarius dwarf galaxy pericentre; and in cyan a very recent star formation burst also detected in the local stellar kinematics (Antoja et al. 2018).
Current usage metrics show cumulative count of Article Views (full-text article views including HTML views, PDF and ePub downloads, according to the available data) and Abstracts Views on Vision4Press platform.
Data correspond to usage on the plateform after 2015. The current usage metrics is available 48-96 hours after online publication and is updated daily on week days.
Initial download of the metrics may take a while.