Fig. A.1.
Download original image
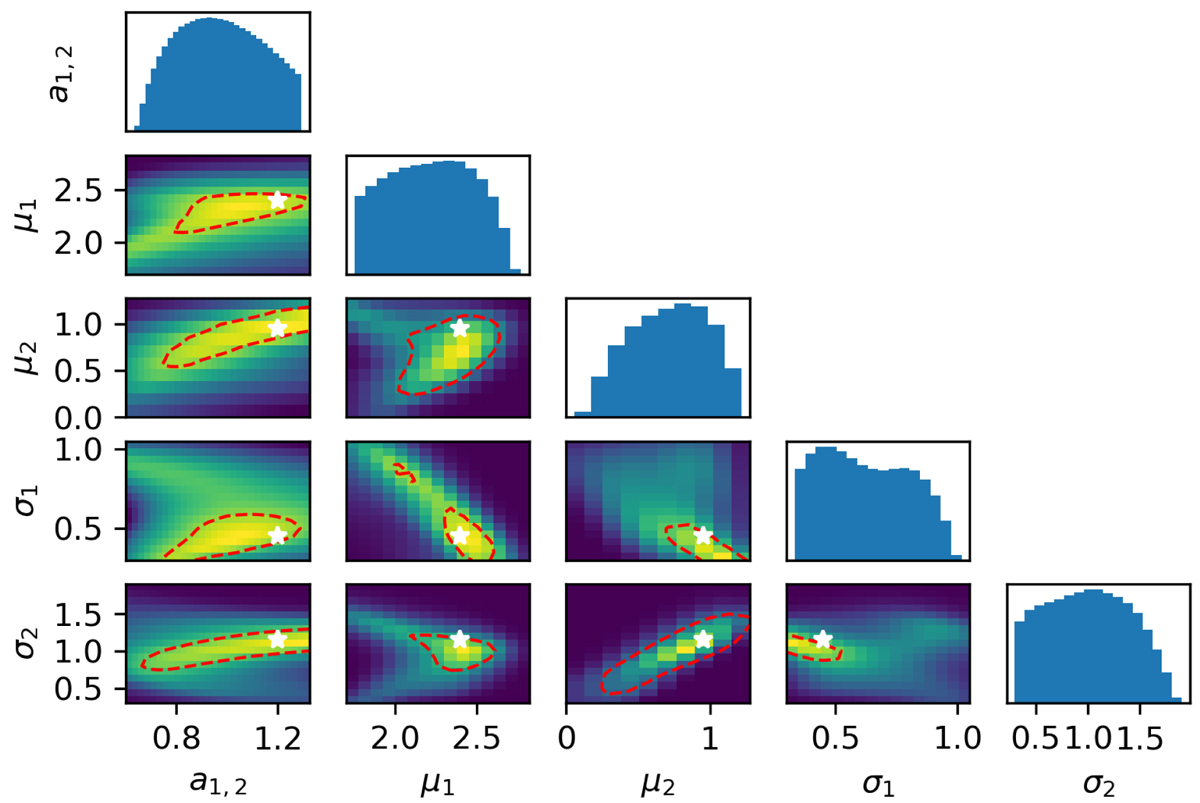
Corner plot showing the p values obtained from the K-S tests in the Y-star sample. We show the full set of p values obtained by scanning a wide range of bi-Gaussian distribution parameters (see Eq. A.1). The red contour line encloses all p values above the 0.05 threshold. The white star shows the location of the highest p value.
Current usage metrics show cumulative count of Article Views (full-text article views including HTML views, PDF and ePub downloads, according to the available data) and Abstracts Views on Vision4Press platform.
Data correspond to usage on the plateform after 2015. The current usage metrics is available 48-96 hours after online publication and is updated daily on week days.
Initial download of the metrics may take a while.