Fig. 8.
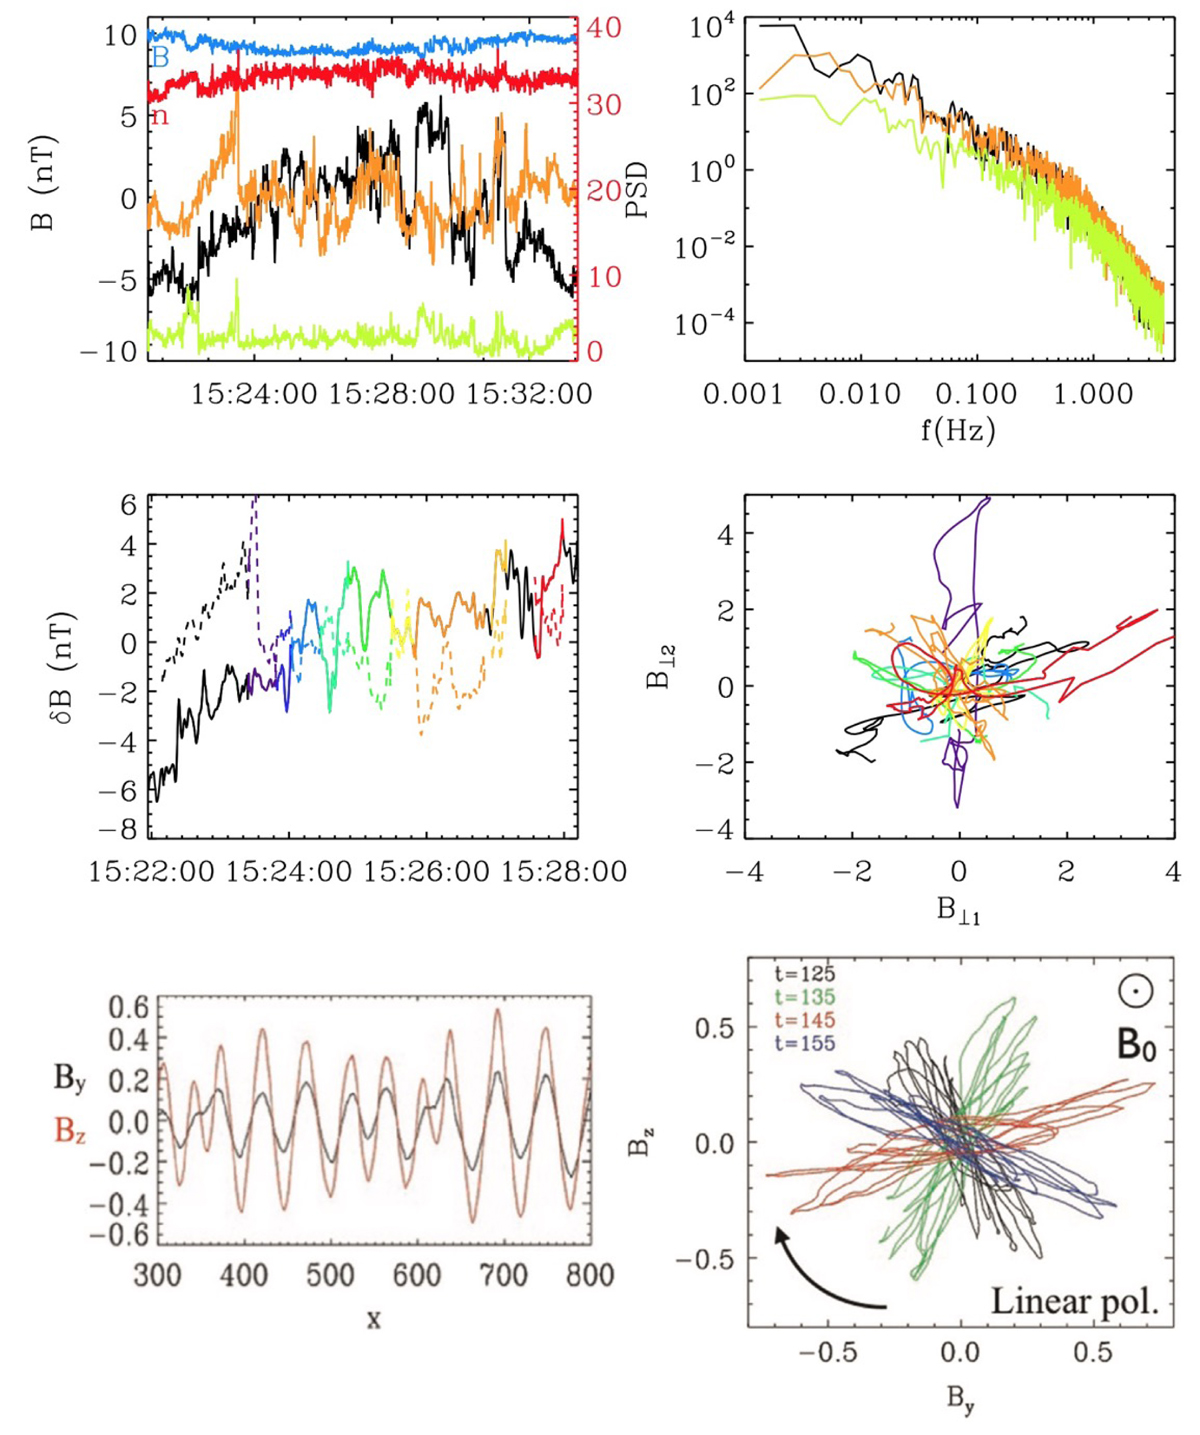
Download original image
Interval 2. Top panels: MVA fluctuations and associated power spectra for interval 2 in Fig. 5. Middle panel: solid and dashed lines in the left panel encode the transverse components of the fluctuations; the two components display a linear polarization (signals in phase or anti-phase). This is confirmed by the hodogram in the right panel: different periods of the wave-form are indicated with different colours; each wave period (colour) correspond to a linear polarization axis with a different inclination in the perpendicular plane. Bottom panels: hybrid simulations results from the instability of non-gyrotropic cometary pick-up ions (from Matteini et al. 2015). As for the middle panels, the bottom left shows the two components of the magnetic field orthogonal to the background field and bottom right their hodogram at different simulation times. The behaviour seen in the simulation matches the observations remarkably well (see text for a discussion).
Current usage metrics show cumulative count of Article Views (full-text article views including HTML views, PDF and ePub downloads, according to the available data) and Abstracts Views on Vision4Press platform.
Data correspond to usage on the plateform after 2015. The current usage metrics is available 48-96 hours after online publication and is updated daily on week days.
Initial download of the metrics may take a while.