Fig. 7.
Download original image
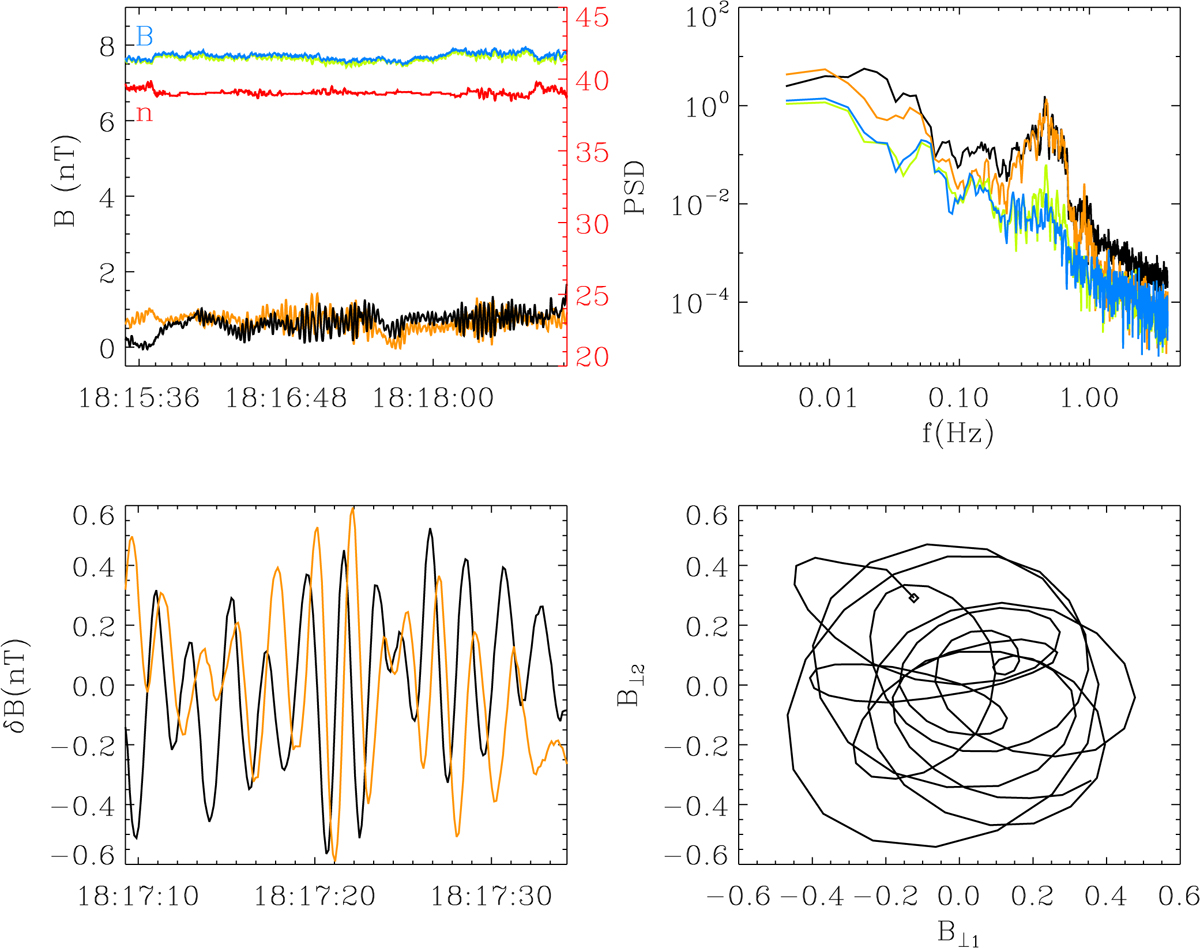
Example of waveform corresponding to proton scale ion-cyclotron waves measured during interval 3 in Fig. 5. Magnetic field components and density are shown in top left panel with the same colour code of Fig. 6. Top-right panel: power spectrum of the fluctuations. Bottom-left panel: fluctuating transverse components over a shorter interval, while bottom-right panel: corresponding hodogram. the diamond identifies the beginning of the interval plotted.
Current usage metrics show cumulative count of Article Views (full-text article views including HTML views, PDF and ePub downloads, according to the available data) and Abstracts Views on Vision4Press platform.
Data correspond to usage on the plateform after 2015. The current usage metrics is available 48-96 hours after online publication and is updated daily on week days.
Initial download of the metrics may take a while.