Fig. 6.
Download original image
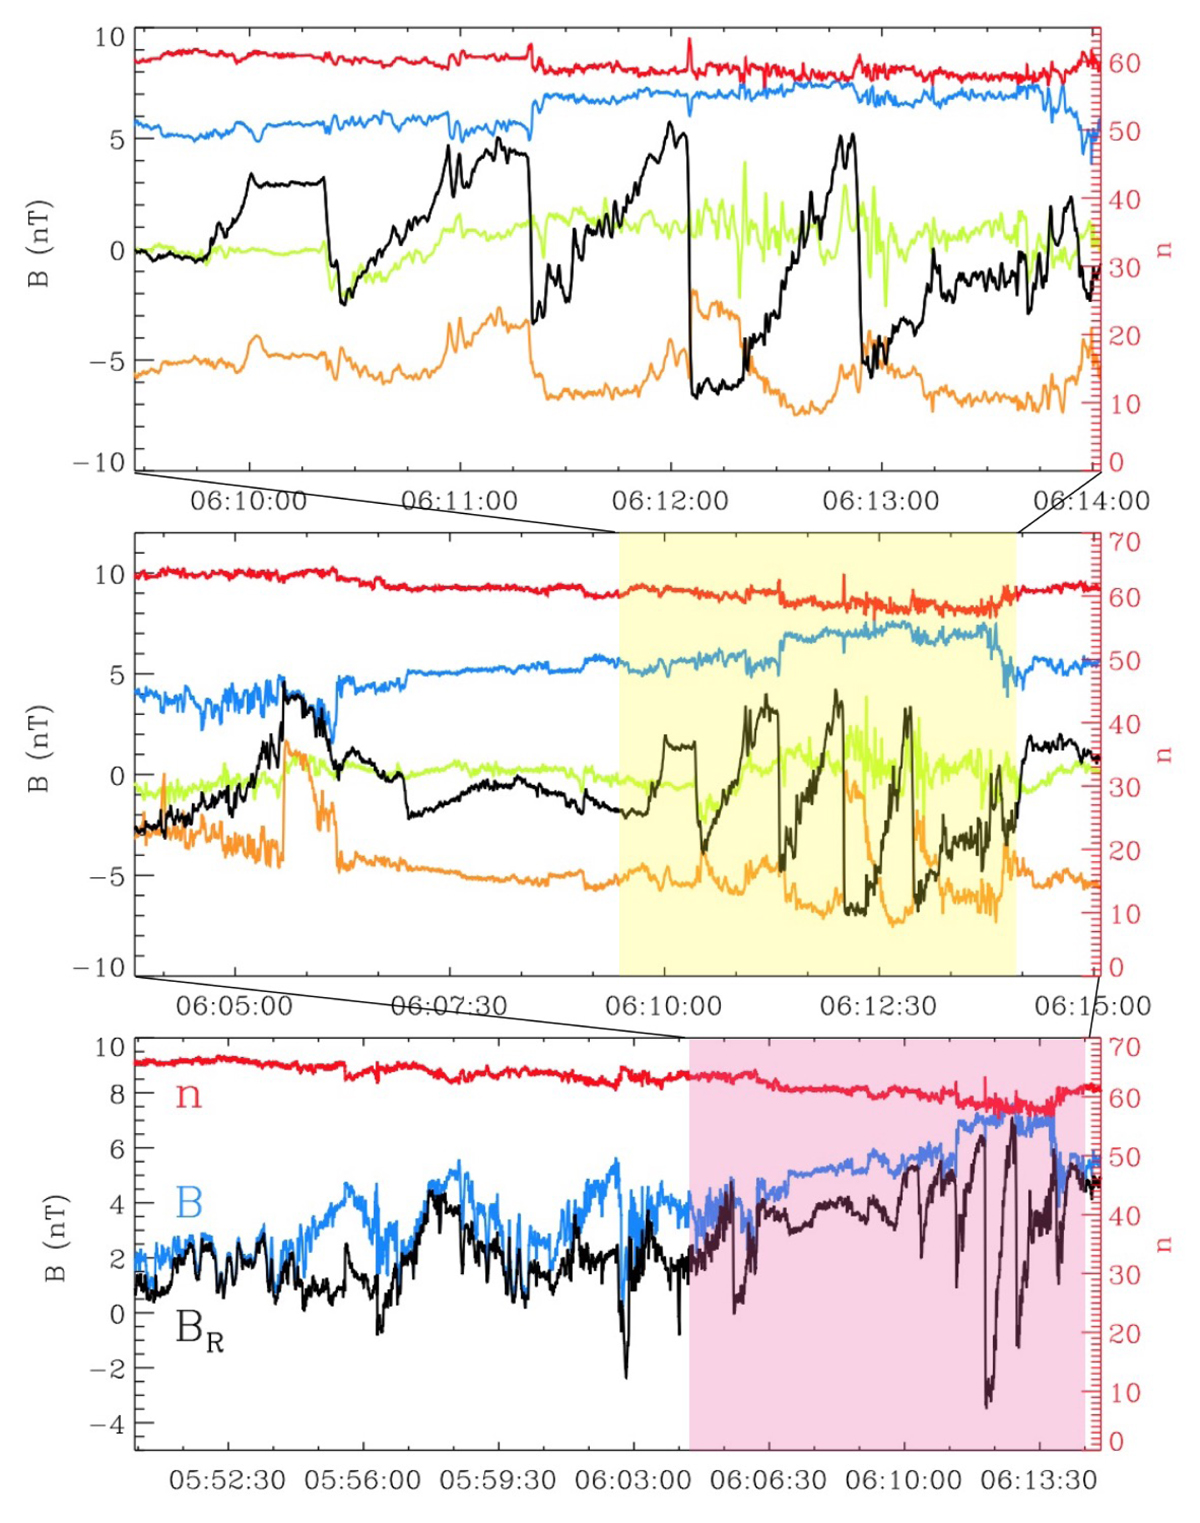
Interval 1. Top: train of rotational discontinuities/steepened Alfvén waves observed inside the low field region B (corresponding to interval 1 in panel g of Fig. 3). The red and blue lines encode the density n and magnetic field B, respectively, and B-components are shown in MVA (Bmax = black, Bint = orange, Bmin = green). Middle: larger interval around the event of the top panel, showing the presence of a counterpropagating packet, with wave-front steepened in the opposite direction and detected earlier by the s/c. Bottom: larger interval containing the wave packets, showing that they are located on a magnetic and density gradient connecting a region of very low field B. In this panel, the black line corresponds to BR.
Current usage metrics show cumulative count of Article Views (full-text article views including HTML views, PDF and ePub downloads, according to the available data) and Abstracts Views on Vision4Press platform.
Data correspond to usage on the plateform after 2015. The current usage metrics is available 48-96 hours after online publication and is updated daily on week days.
Initial download of the metrics may take a while.