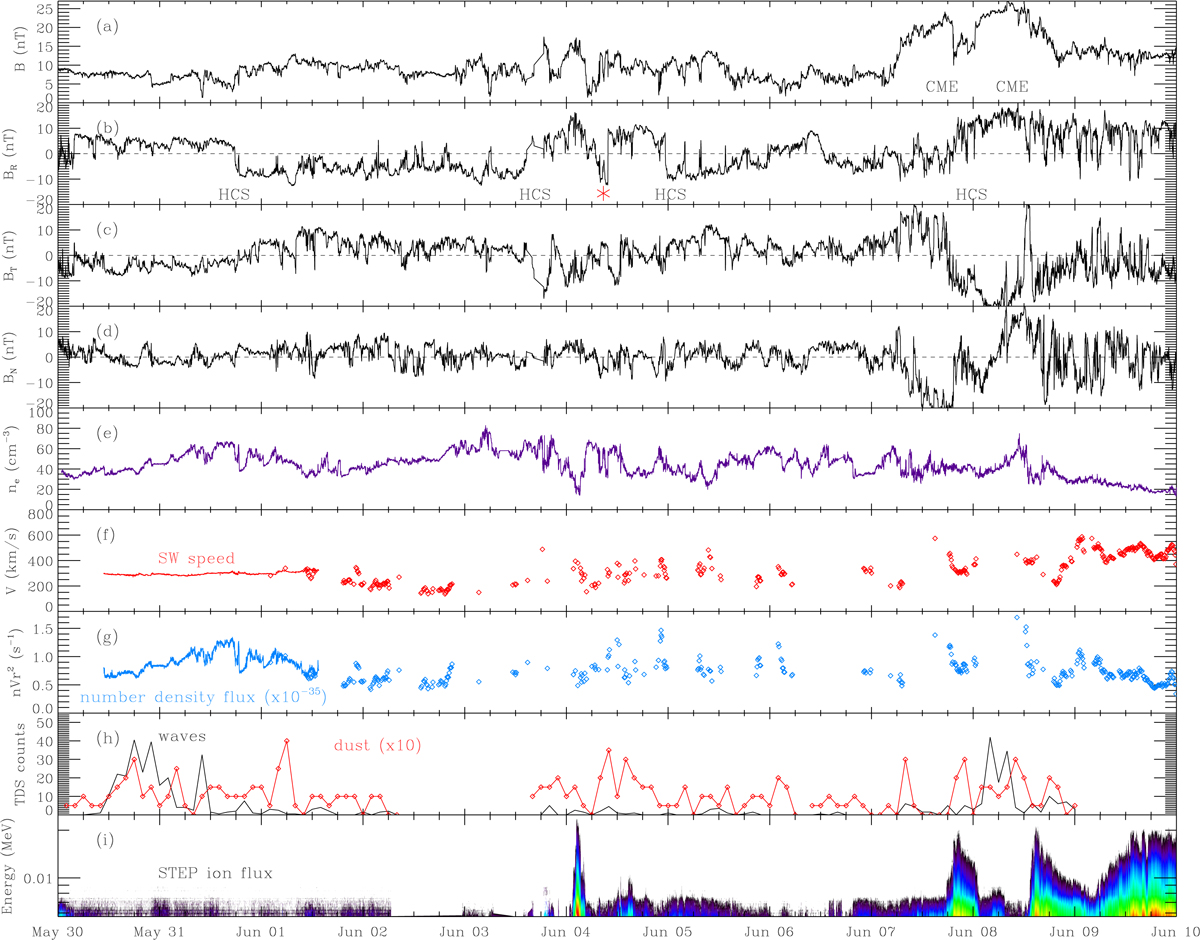
Fig. 2.
Download original image
Context of the Solar Orbiter comet ATLAS encounter. Panels a–d: data from the MAG magnetometer, panel e: RPW plasma density measurements from the spacecraft potential, while panels f and g: RPW estimations (diamonds) of the flow speed (red) and number density flux (blue). In the same panels, measurements from SWA/PAS are shown as a solid line. Panel h: statistical counts of high-frequency waves and dust impacts from TDS. The last panel i displays the STEP ion flux; coloured contour refers to flux intensities in the range 103 − 108[cm2 s sr MeV]−1. Panel a–b: labels indicate HCS crossings localised by Laker et al. (2021) and the double-CME event (discussed by Telloni et al. 2021). The red asterisk in panel b identifies a magnetic field structure observed at the beginning of 4 June, associated with a full magnetic reversal, a local deceleration of the flow, large density modulations, and enhanced dust and energetic ion events.
Current usage metrics show cumulative count of Article Views (full-text article views including HTML views, PDF and ePub downloads, according to the available data) and Abstracts Views on Vision4Press platform.
Data correspond to usage on the plateform after 2015. The current usage metrics is available 48-96 hours after online publication and is updated daily on week days.
Initial download of the metrics may take a while.