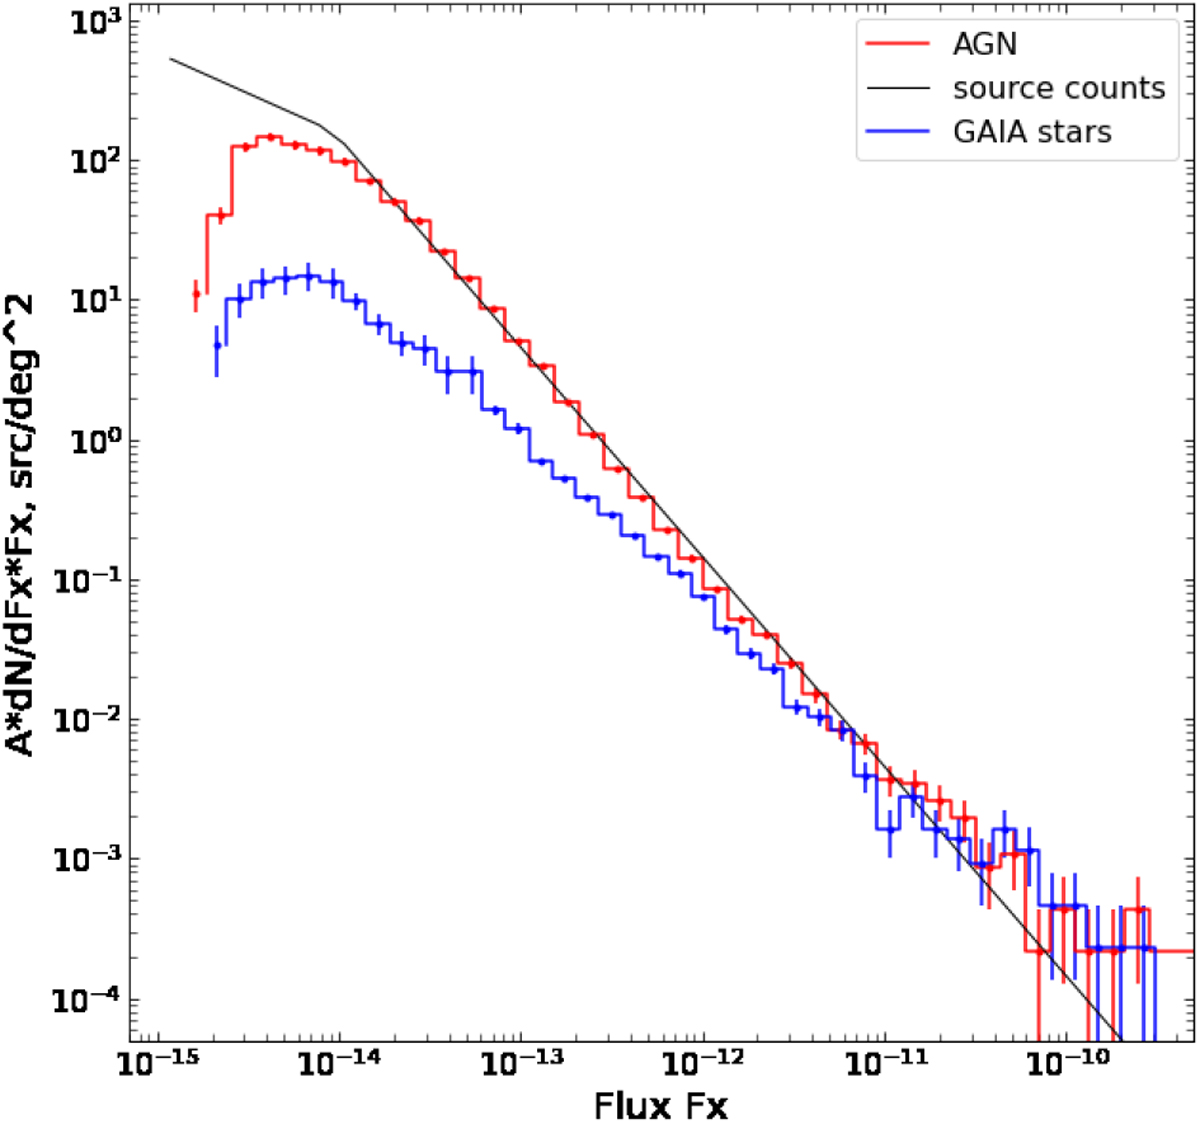
Fig. 28
Download original image
Preliminary log(N) − log(S) distributions of compact sources in the extragalactic part of the hemisphere, where the Russian consortium of scientists is responsible for the data analysis and interpretation. The distribution of sources with and without Gaia stars among their optical counterparts are shown by blue and red histograms and are marked in the plot legend as Gaia stars and AGN, respectively. The distributions are derived from partial data of the first two sky surveys and do not use the full potential of the first-year data. No incompleteness correction was applied at the faint flux end. The coefficient A on the y-axis incorporates approximations and inaccuracies of the preliminary analysis. It is reasonably close to unity and may weakly depend on flux, which is not necessarily the same for Gaia stars and AGN.
Current usage metrics show cumulative count of Article Views (full-text article views including HTML views, PDF and ePub downloads, according to the available data) and Abstracts Views on Vision4Press platform.
Data correspond to usage on the plateform after 2015. The current usage metrics is available 48-96 hours after online publication and is updated daily on week days.
Initial download of the metrics may take a while.