Fig. 27
Download original image
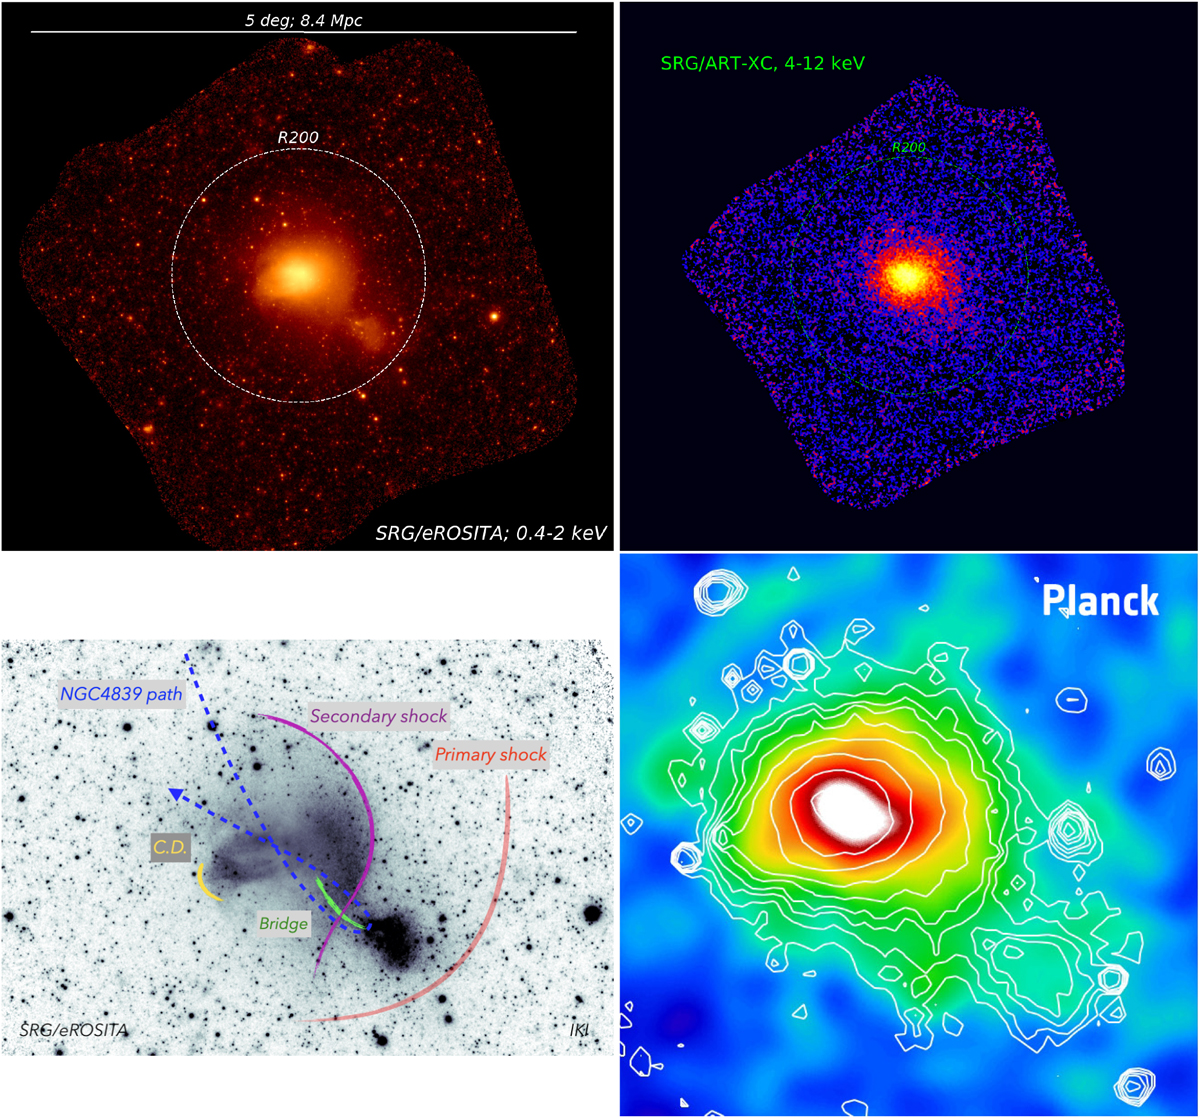
X-ray image of the Coma cluster (Churazov et al. 2021) in the 0.4–2 keV band obtained by eROSITA in the course of the CalPV program (top left). The image is ~ 6 degrees on a side, corresponding to 10 Mpc at the distance of the cluster, with the logarithmic color-code spanning five orders of magnitude. The main cluster is in the process of merging with the NGC 4839 group (a bright blob in the bottom right corner from the Coma cluster). Flattened X-ray image of the Coma cluster field (bottom left). The labels schematically mark some of the features that are presumably associated with the merger with the NGC 4839 group. The dashed blue line is the suggested trajectory of the group, which enters the Coma cluster from the northeast direction, and is currently close to apocenter. The presumed positions of two shocks driven by the NGC 4839 group are shown with the red and purple curves. The shock closer to the center is driven by the displaced gas that settles back to hydrostatic equilibrium. This is the most salient feature that can be directly seen in the image at the surface brightness edge. The green line shows the faint X-ray bridge connecting NGC 4839 and the main cluster, which is a possible trace of the group passage through the Coma cluster. The yellow line shows the contact discontinuity, which is an interface between cold and hot gas patches with the same pressure. See Churazov et al. (2021) for details. ART-XC image of the Coma Cluster in the 4–12 keV energy band (top right).Planck spacecraft y-parameter map of the Coma cluster, based on the data in the microwave spectral band (bottom right). The morphology of this map, which reflects the distribution of the hot gas electron pressure, is strikingly similar to the eROSITA image in the X-ray band.
Current usage metrics show cumulative count of Article Views (full-text article views including HTML views, PDF and ePub downloads, according to the available data) and Abstracts Views on Vision4Press platform.
Data correspond to usage on the plateform after 2015. The current usage metrics is available 48-96 hours after online publication and is updated daily on week days.
Initial download of the metrics may take a while.