Fig. 17
Download original image
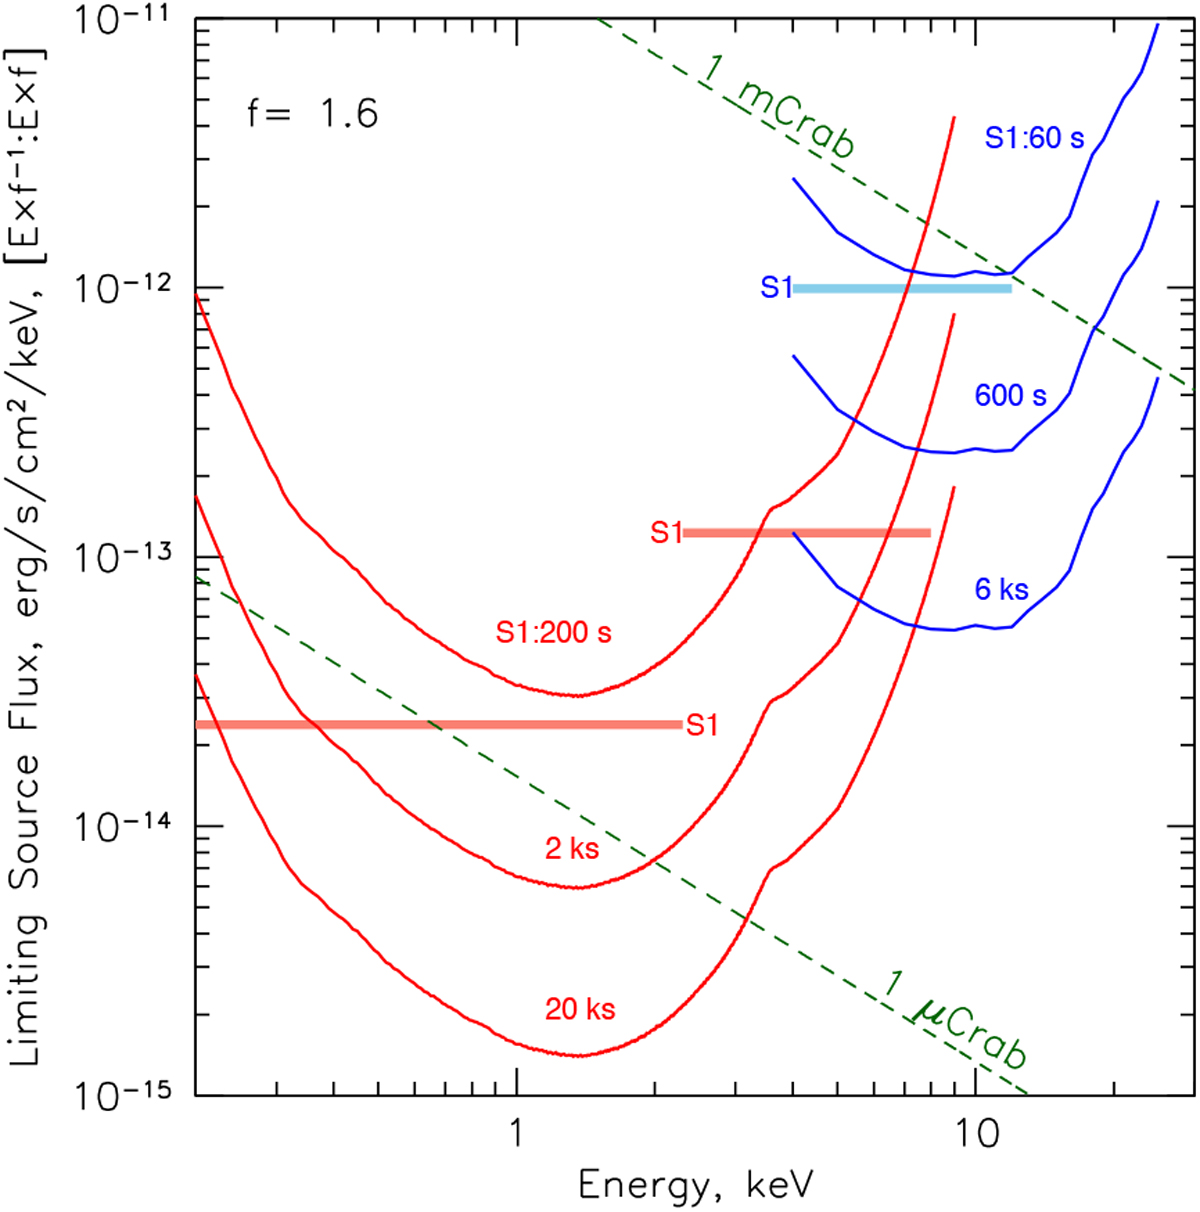
Estimated sensitivities of the eROSITA (red) and ART-XC (blue) telescopes for a continuum spectrum in the energy interval ΔE ~ E as a function of energy. The curves show the sensitivity in units of energy flux density, i.e., erg s−1 cm−2 keV−1, evaluated for an interval of energies between E1 = E∕f and E2 = E × f, where f = 1.6. The top curves, labeled S1, correspond to the sensitivity achieved during the first all-sky survey close to the ecliptic equator, where the exposure time is shortest. The difference in the effective time (200 s vs. 60 s for eROSITA and ART-XC, respectively) reflects the difference in the FoVs of the two instruments. Also shown are the sensitivity curves for 10 and 100 times deeper exposures. The horizontal bars show the broadband (0.2–2.3 keVand 2.3–8 keV for eROSITA and 4–12 keV for ART-XC) sensitivities in the first survey, approximately converted into units of flux density. The spectrum of the Crab nebula scaled to a flux of 1 mCrab and 1 μCrab is shown for comparison.
Current usage metrics show cumulative count of Article Views (full-text article views including HTML views, PDF and ePub downloads, according to the available data) and Abstracts Views on Vision4Press platform.
Data correspond to usage on the plateform after 2015. The current usage metrics is available 48-96 hours after online publication and is updated daily on week days.
Initial download of the metrics may take a while.