Fig. 14
Download original image
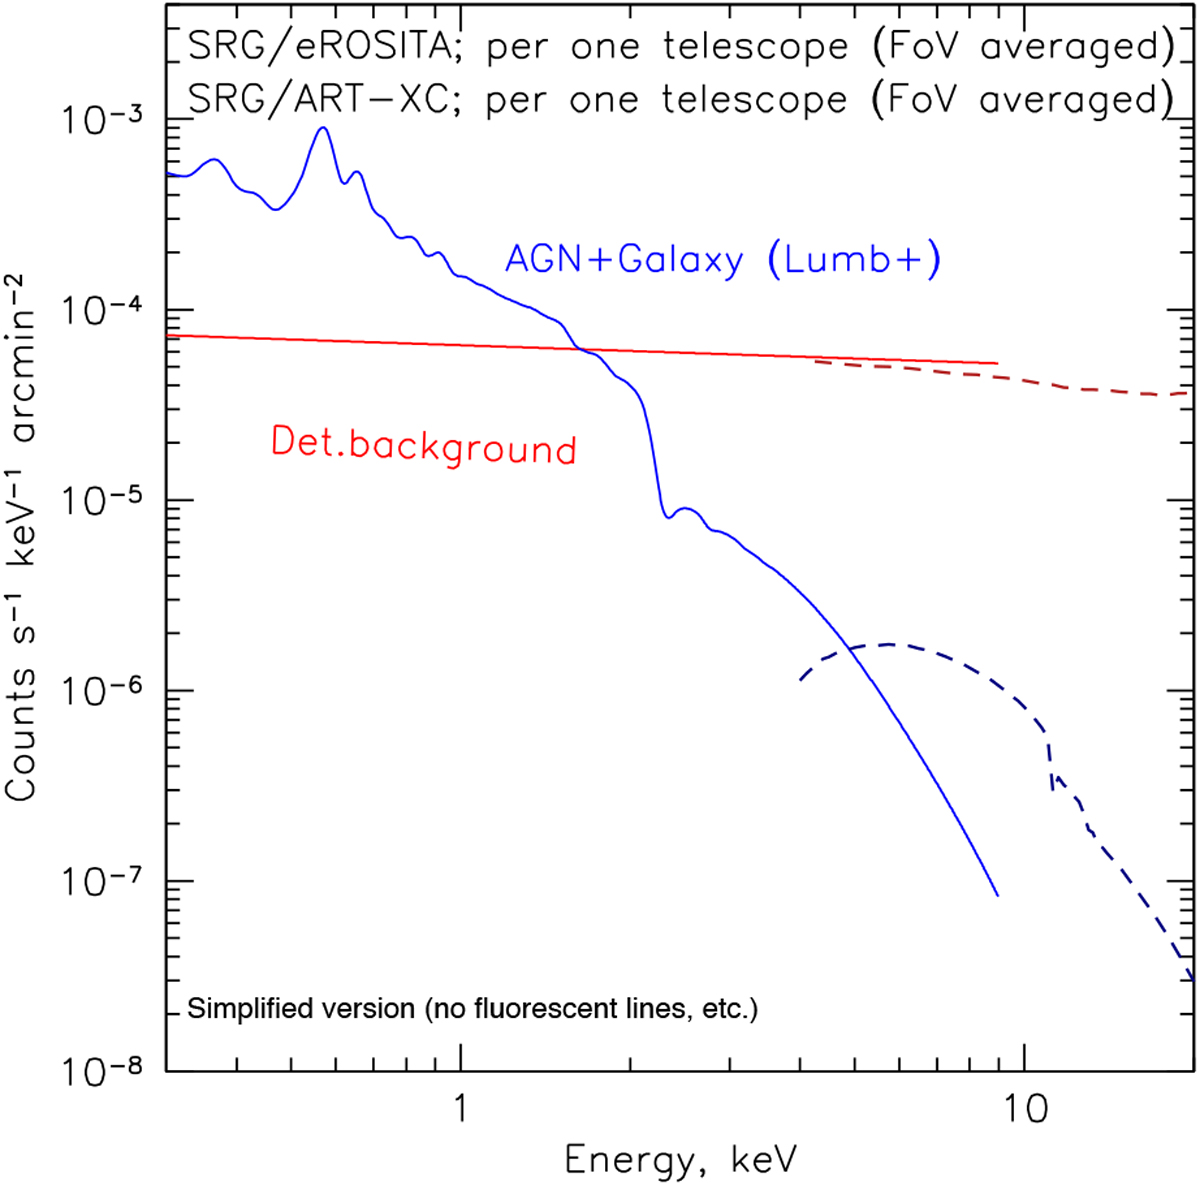
Sketch of ART-XC (dashed lines) and eROSITA (solid lines) astrophysical and internal detector backgrounds. The blue lines show the estimated sky background using the models of Lumb et al. (2002) and Gruber et al. (1999), convolved with the telescopes’ responses averaged over the FoV. The red lines show the level of the detector internal background (fluorescent lines are not shown). For eROSITA, the astrophysical background dominates below ~ 2 keV, while at higher energies, the detector background exceeds the sky background by an order of magnitude.
Current usage metrics show cumulative count of Article Views (full-text article views including HTML views, PDF and ePub downloads, according to the available data) and Abstracts Views on Vision4Press platform.
Data correspond to usage on the plateform after 2015. The current usage metrics is available 48-96 hours after online publication and is updated daily on week days.
Initial download of the metrics may take a while.