Fig. 11
Download original image
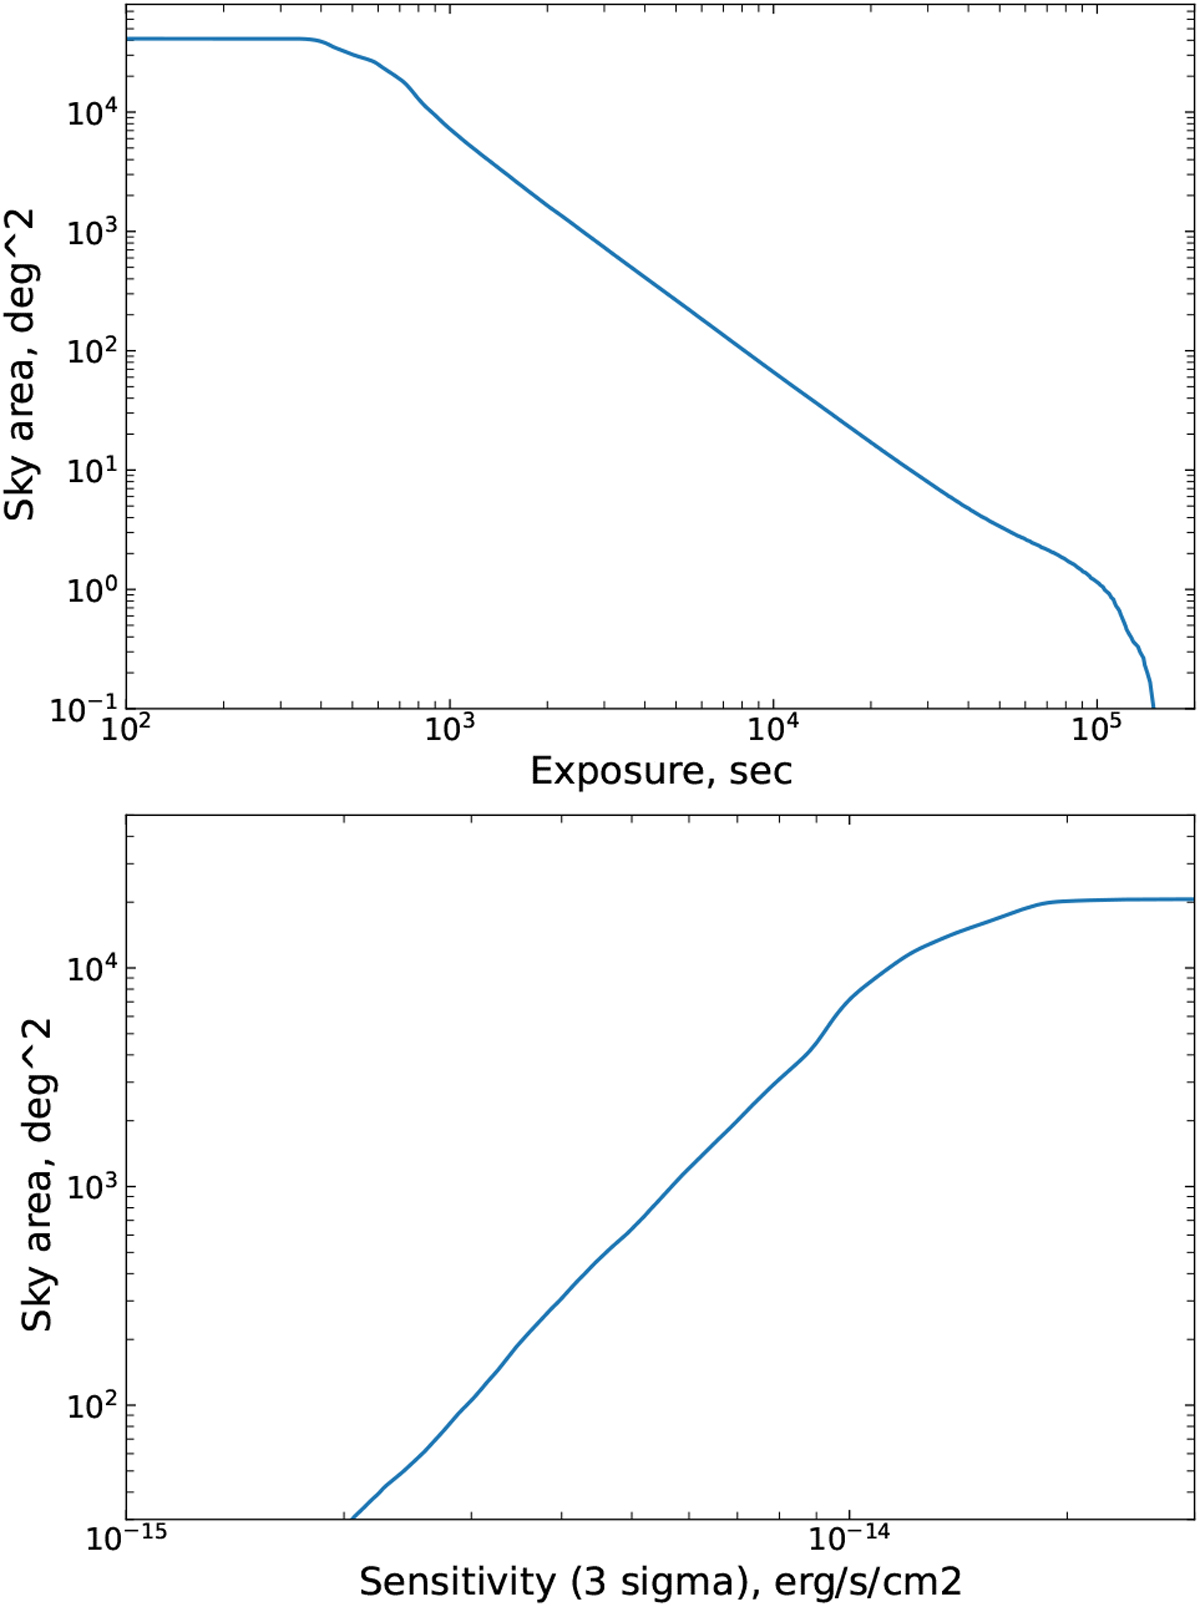
Distribution of eROSITA exposure (upper panel) and sensitivity in the 0.3–2.2 keV energy band (lower panel) after the first three all-sky surveys. The solid curve in the upper panel shows the area of the sky in which the eROSITA exposure exceeded the given value. The solid curve in the lower panel shows the area of the sky in the hemisphere analyzed by the Russian consortium in which the 3σ sensitivity is better than the given value.
Current usage metrics show cumulative count of Article Views (full-text article views including HTML views, PDF and ePub downloads, according to the available data) and Abstracts Views on Vision4Press platform.
Data correspond to usage on the plateform after 2015. The current usage metrics is available 48-96 hours after online publication and is updated daily on week days.
Initial download of the metrics may take a while.