Fig. 10
Download original image
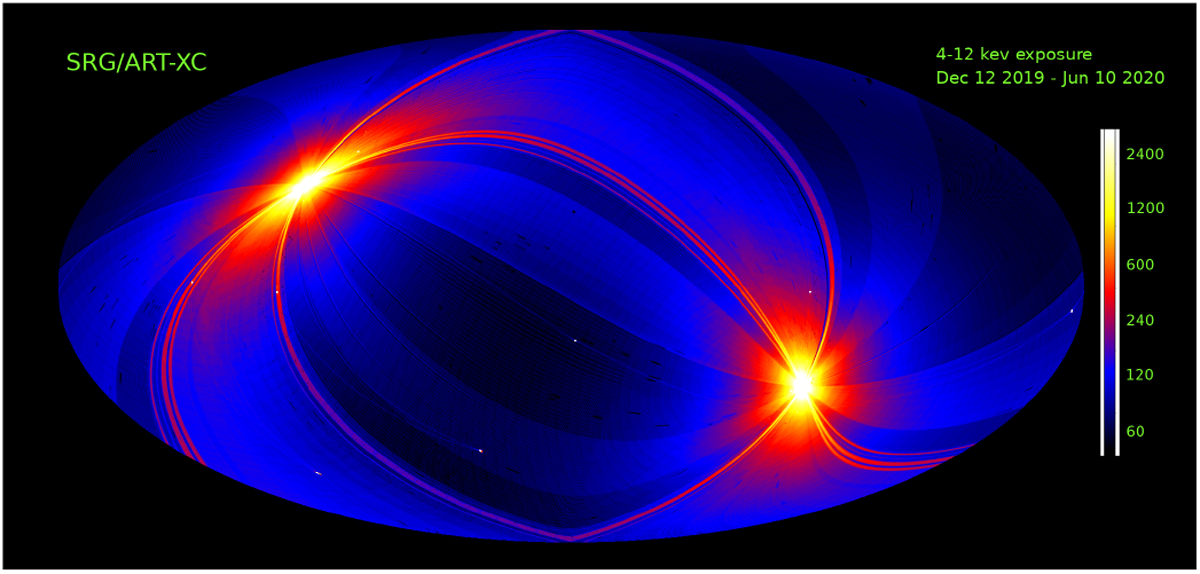
Exposure map (in Galactic coordinates) of the first all-sky survey by the ART-XC telescope. Exposure time is given in seconds (see the color scale shown on the right). The white spots in the map correspond to the ecliptic poles. Exposure times for eROSITA are approximately three times longer than for ART-XC, in accordance with the instruments’ FoV (36′ and 1.03 °, respectively).
Current usage metrics show cumulative count of Article Views (full-text article views including HTML views, PDF and ePub downloads, according to the available data) and Abstracts Views on Vision4Press platform.
Data correspond to usage on the plateform after 2015. The current usage metrics is available 48-96 hours after online publication and is updated daily on week days.
Initial download of the metrics may take a while.