Fig. 9.
Download original image
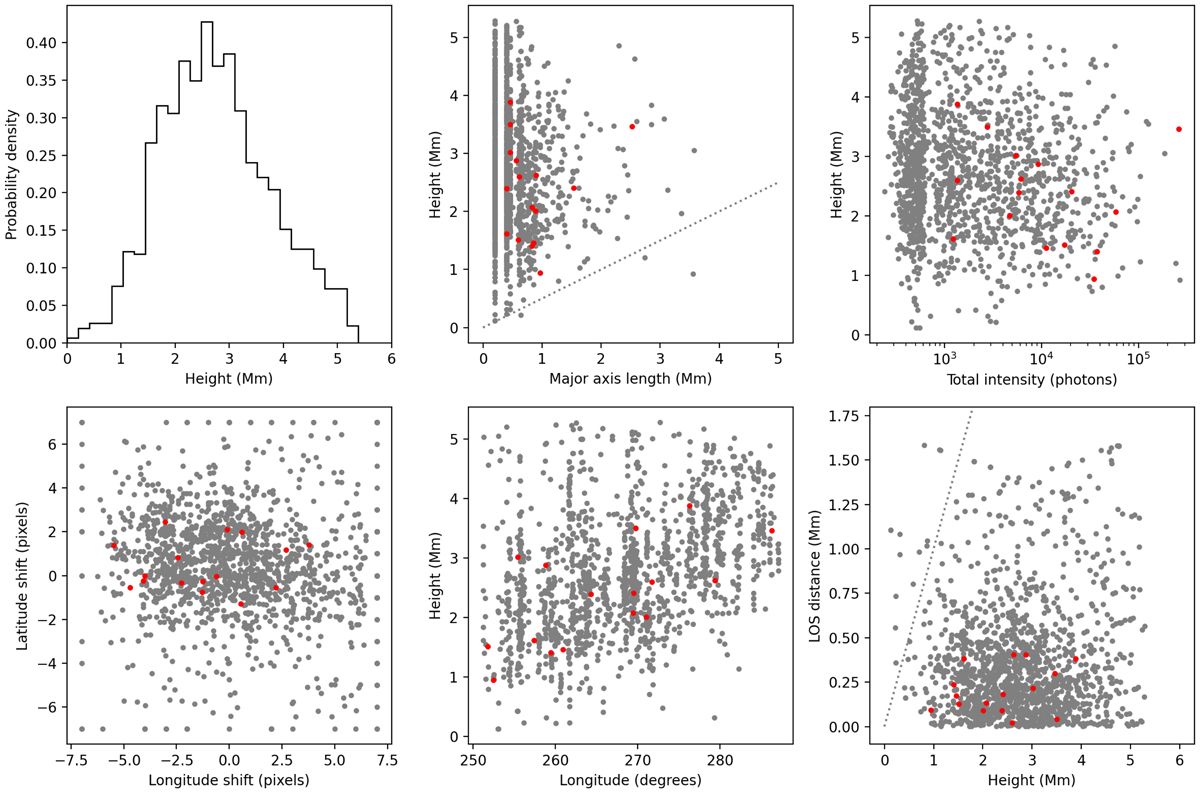
Results of the automatic triangulation. Top left: histogram of triangulated campfire heights. Top middle: scatter plot of height vs. the major axis length (the dotted line shows the H = L/2 relation, the red dots correspond to events triangulated manually in Sect. 3). Top right: scatter plot of height vs. the total intensity of a campfire. Bottom left: scatter plot of campfire shifts in latitude and longitude between the HRIEUV and AIA 171 Å images. Bottom middle: scatter plot of campfire height vs. the longitude. Bottom right: scatter plot of the length of the shortest segment between the HRIEUV and AIA 171 Å lines of sight for each campfire vs. its height. Most events lie below the dashed line indicating equal segment length and height.
Current usage metrics show cumulative count of Article Views (full-text article views including HTML views, PDF and ePub downloads, according to the available data) and Abstracts Views on Vision4Press platform.
Data correspond to usage on the plateform after 2015. The current usage metrics is available 48-96 hours after online publication and is updated daily on week days.
Initial download of the metrics may take a while.