Fig. 8.
Download original image
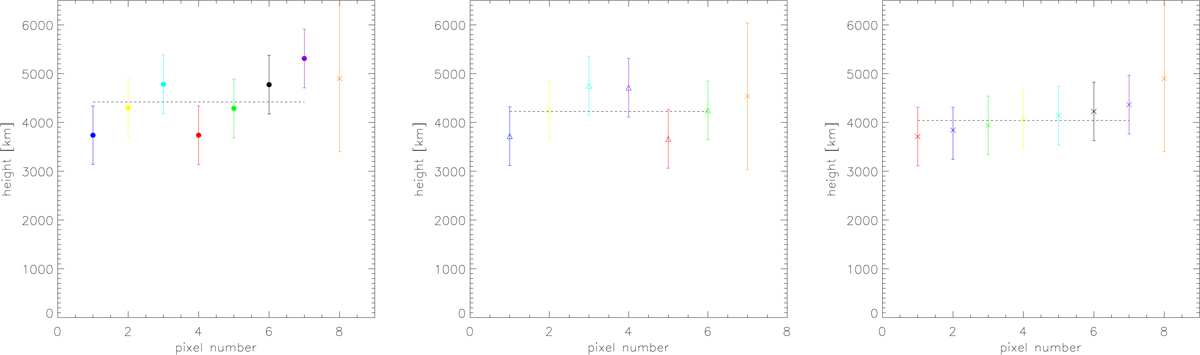
Heights of individual pixels of campfire 15. Left panel: heights of pixels marked with colored circles in the top panels of Fig. 7, together with the height of the whole campfire triangulated starting from the HRIEUV data (as reported in Fig. 6) shown with the orange cross. Middle panel: heights of individual pixels marked with colored triangles in the middle panels of Fig. 7, together with the height of the whole campfire triangulated starting from the SDO/AIA data shown with the orange cross. Right panel: heights of points marked with colored crosses along the epipolar line shown in the bottom panels of Fig. 7. In all panels, the horizontal dashed line marks the average of individual pixels.
Current usage metrics show cumulative count of Article Views (full-text article views including HTML views, PDF and ePub downloads, according to the available data) and Abstracts Views on Vision4Press platform.
Data correspond to usage on the plateform after 2015. The current usage metrics is available 48-96 hours after online publication and is updated daily on week days.
Initial download of the metrics may take a while.