Free Access
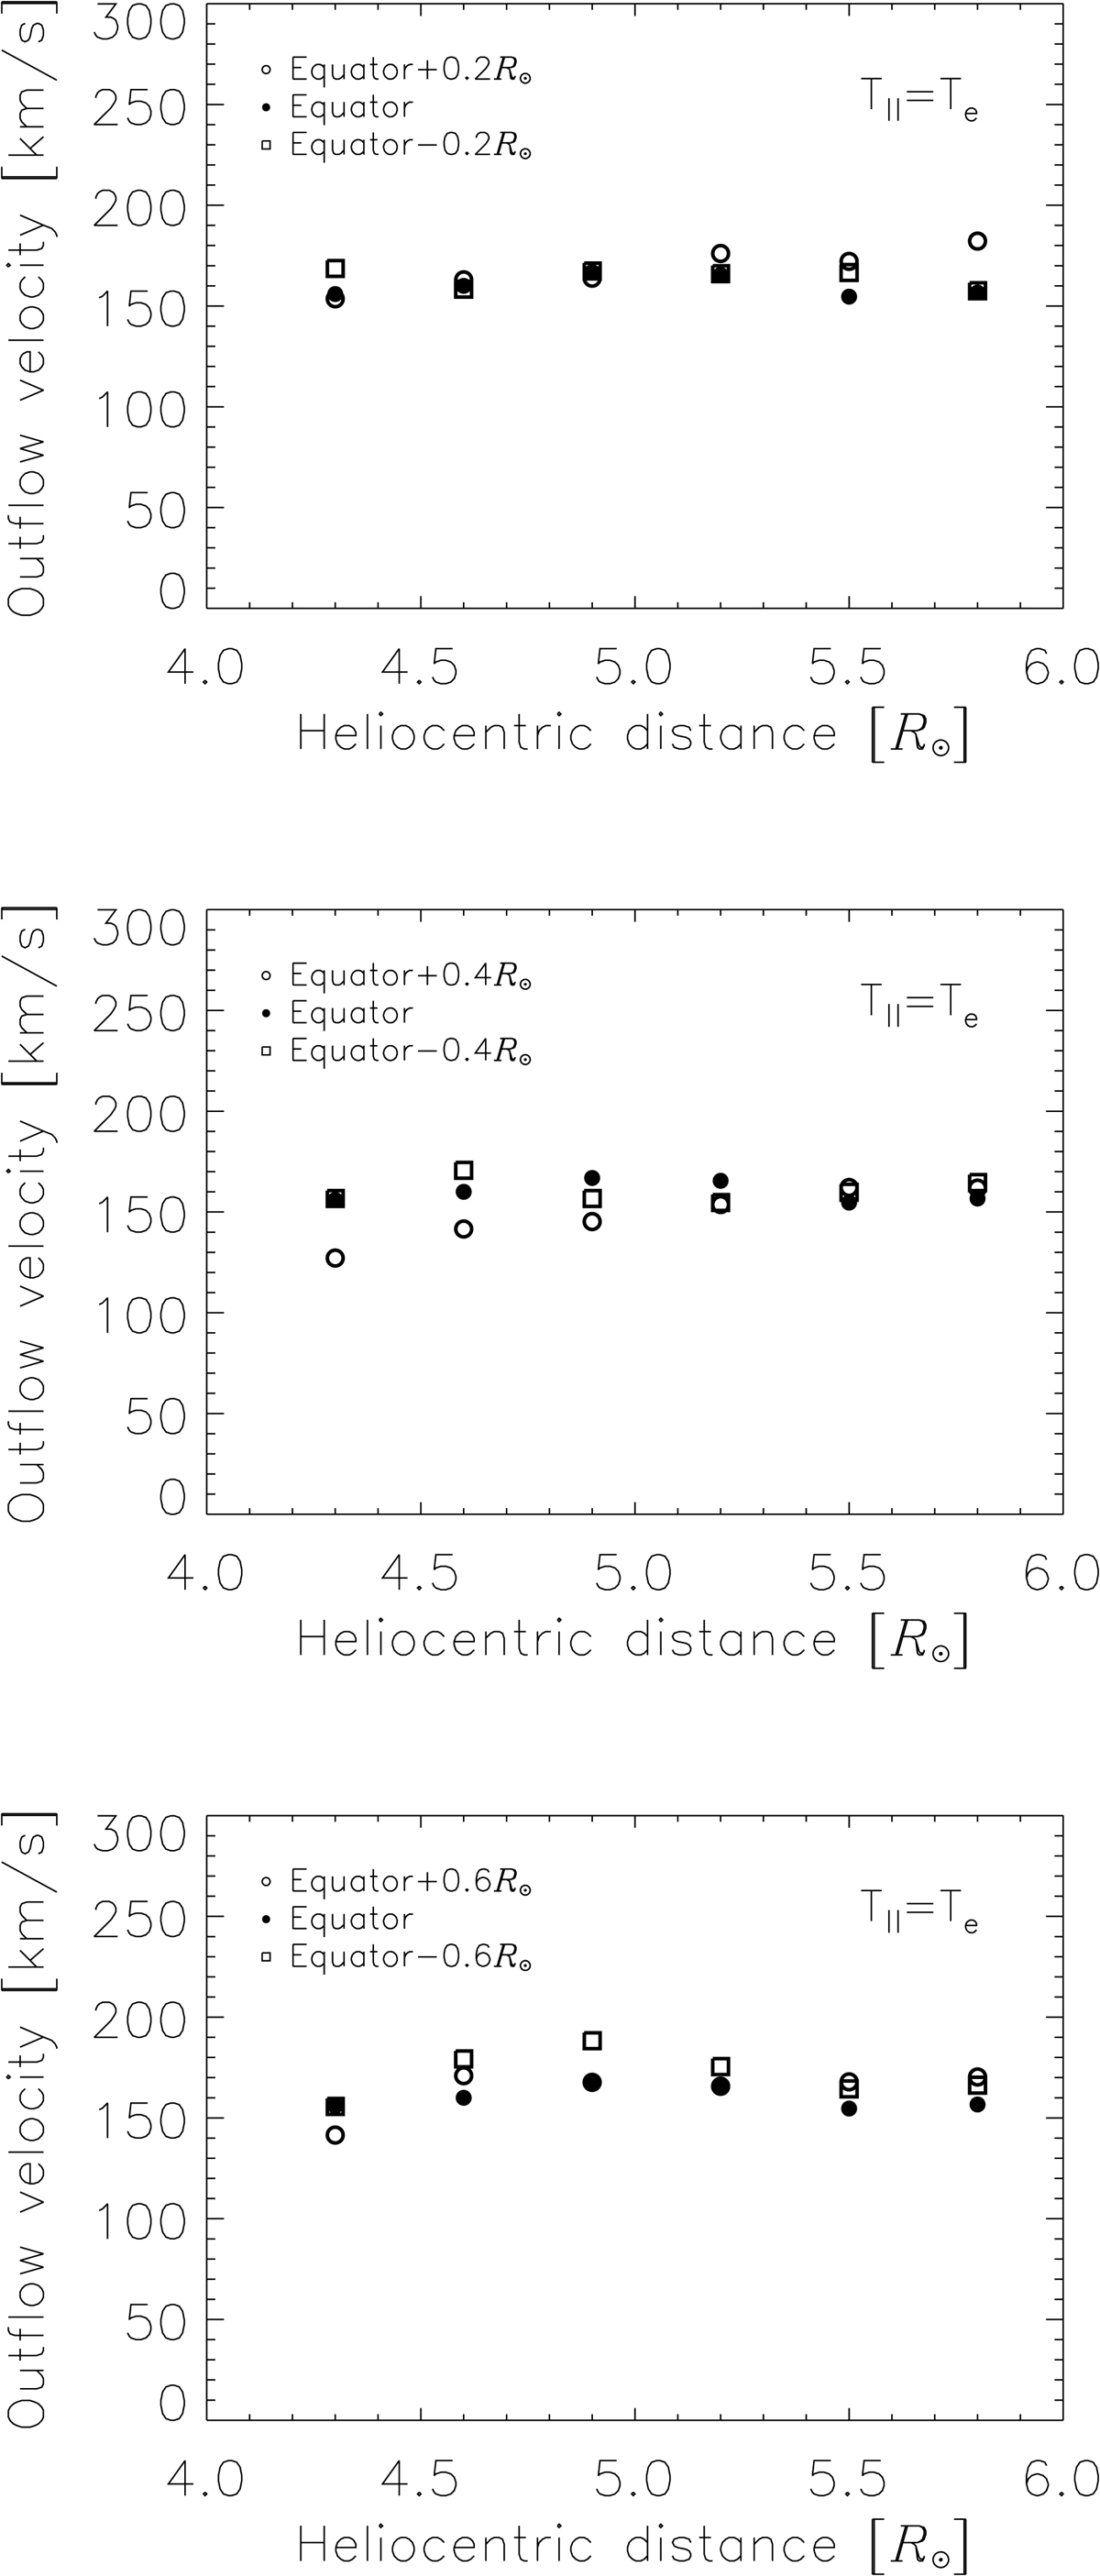
Fig. 7.
Download original image
Outflow velocity along the axis of the east coronal streamer (full dots) at the equator; the velocity curves denoted by open circles and open squares are computed at a distance from the equator varying from ±0.2 R⊙ (upper panel) and ±0.4 R⊙ (mid panel) to ±0.6 R⊙ (lower panel), respectively at the north (+) and south (−).
Current usage metrics show cumulative count of Article Views (full-text article views including HTML views, PDF and ePub downloads, according to the available data) and Abstracts Views on Vision4Press platform.
Data correspond to usage on the plateform after 2015. The current usage metrics is available 48-96 hours after online publication and is updated daily on week days.
Initial download of the metrics may take a while.