Fig. 2.
Download original image
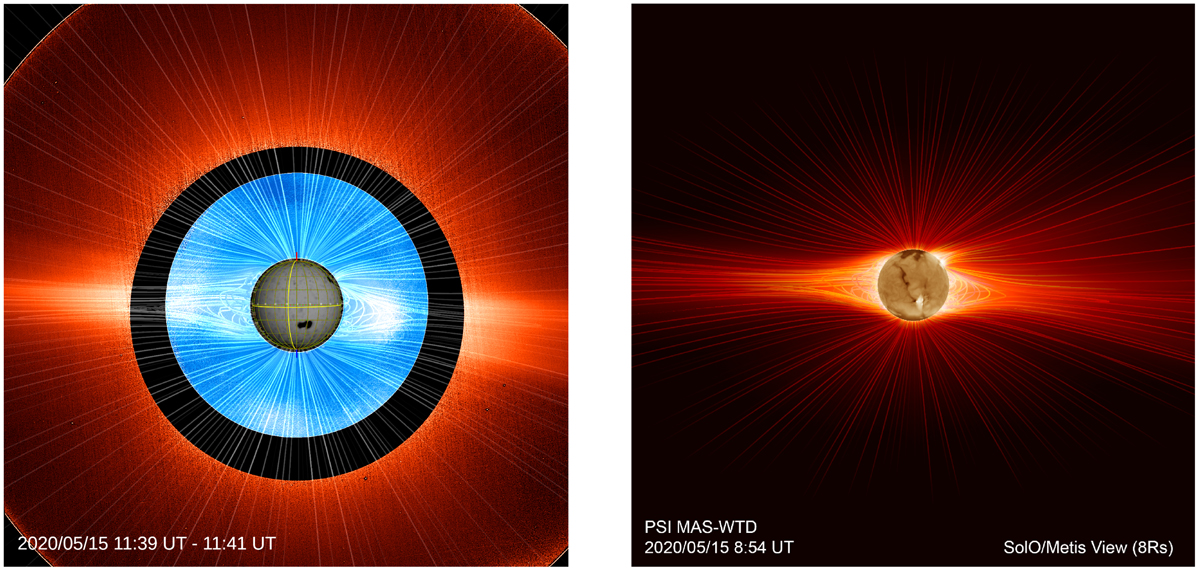
Composite image of the outer corona, observed with the Metis coronagraph in polarized visible light, and of the medium and inner corona observed at the Mauna Loa Solar Observatory, with the inner magnetic boundary condition (Br) of the PSI-MHD model at 1 R⊙ (left panel). Field lines traced near the plane-of-sky from the PSI-MHD simulation are overlaid over the composite image. The right panel shows the same field lines, but now with forward modeled SDO/AIA 193 Å and polarized brightness observables computed directly from the simulation.
Current usage metrics show cumulative count of Article Views (full-text article views including HTML views, PDF and ePub downloads, according to the available data) and Abstracts Views on Vision4Press platform.
Data correspond to usage on the plateform after 2015. The current usage metrics is available 48-96 hours after online publication and is updated daily on week days.
Initial download of the metrics may take a while.