Fig. 8.
Download original image
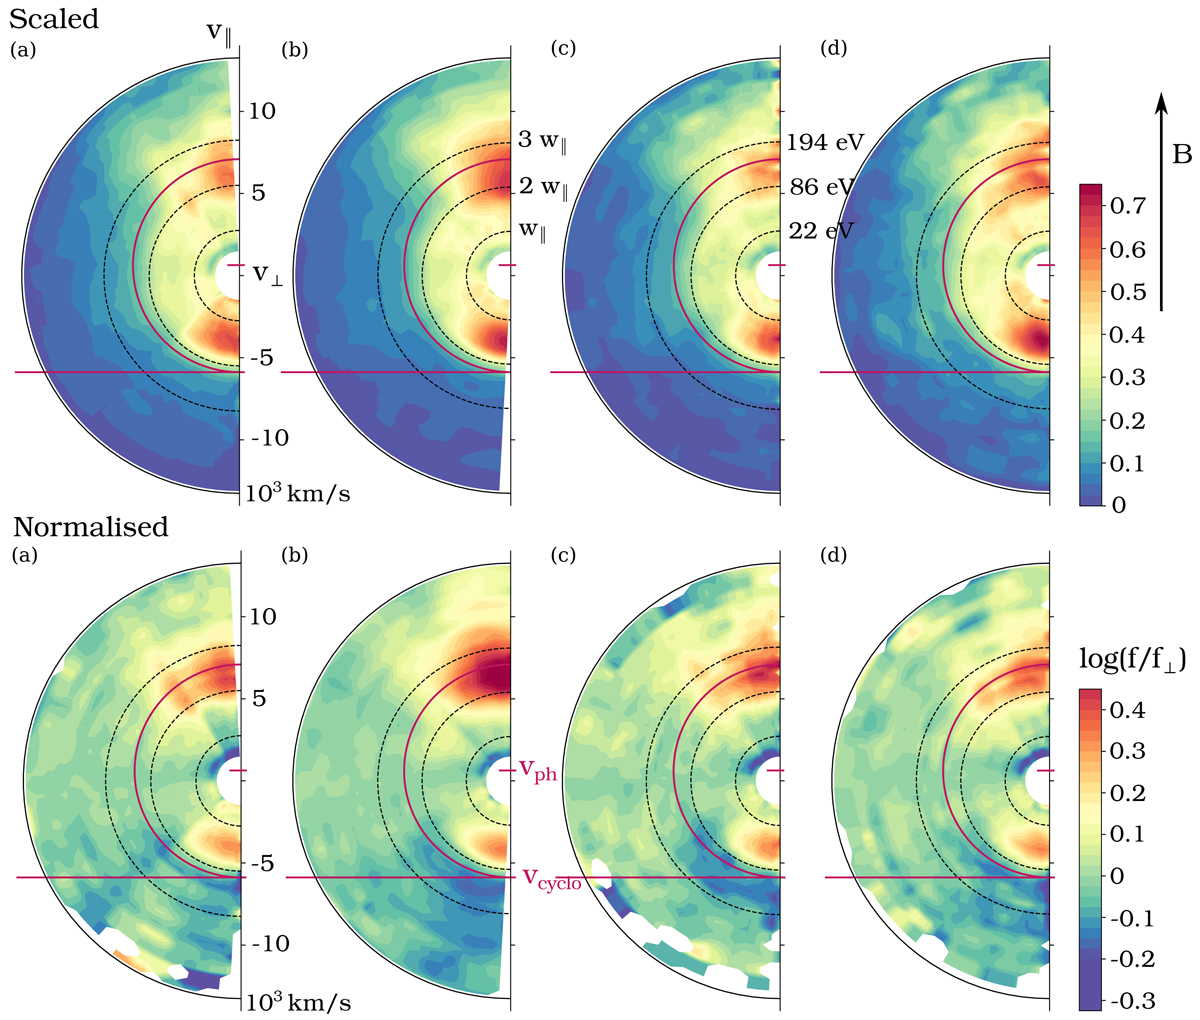
Electron VDFs measured in BM averaged over the time periods corresponding to those shown in Figs. 5 and 7, in two representations highlighting departures from an isotropic distribution function. The first row displays the ‘scaled’ VDFs, where the values in each energy belt are scaled between 0 and 1. The second row displays the ‘normalised’ VDFs, where all values are normalised to the cut along the perpendicular direction. The magnetic-field direction is indicated with an arrow on the right-hand side and is aligned with the Y-axis. Black dashed semi-circles denote 1, 2, and 3 wc.
Current usage metrics show cumulative count of Article Views (full-text article views including HTML views, PDF and ePub downloads, according to the available data) and Abstracts Views on Vision4Press platform.
Data correspond to usage on the plateform after 2015. The current usage metrics is available 48-96 hours after online publication and is updated daily on week days.
Initial download of the metrics may take a while.