Fig. 7.
Download original image
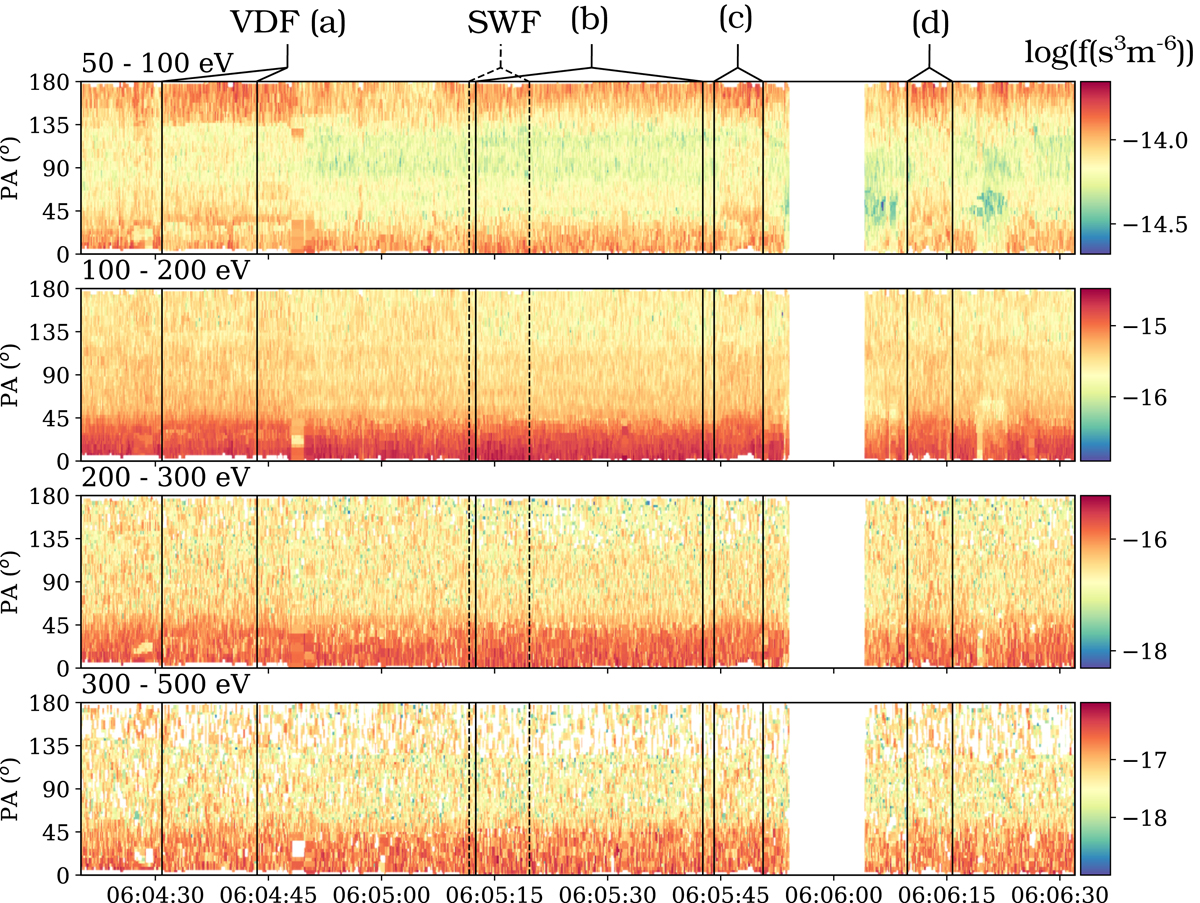
BM pitch-angle distributions (PADs) averaged over different energy ranges (indicated in the title of each plot). The colour coding represents the logarithm of the electron VDF. The vertical black lines are the same as in Fig. 5 and denote the intervals of integration of electron VDFs shown in Fig. 8 and the snapshot waveform interval. The gap in the data set beginning at around 06:06:00 is due to the extreme elevation setting in the relevant EAS head (see Fig. 3).
Current usage metrics show cumulative count of Article Views (full-text article views including HTML views, PDF and ePub downloads, according to the available data) and Abstracts Views on Vision4Press platform.
Data correspond to usage on the plateform after 2015. The current usage metrics is available 48-96 hours after online publication and is updated daily on week days.
Initial download of the metrics may take a while.