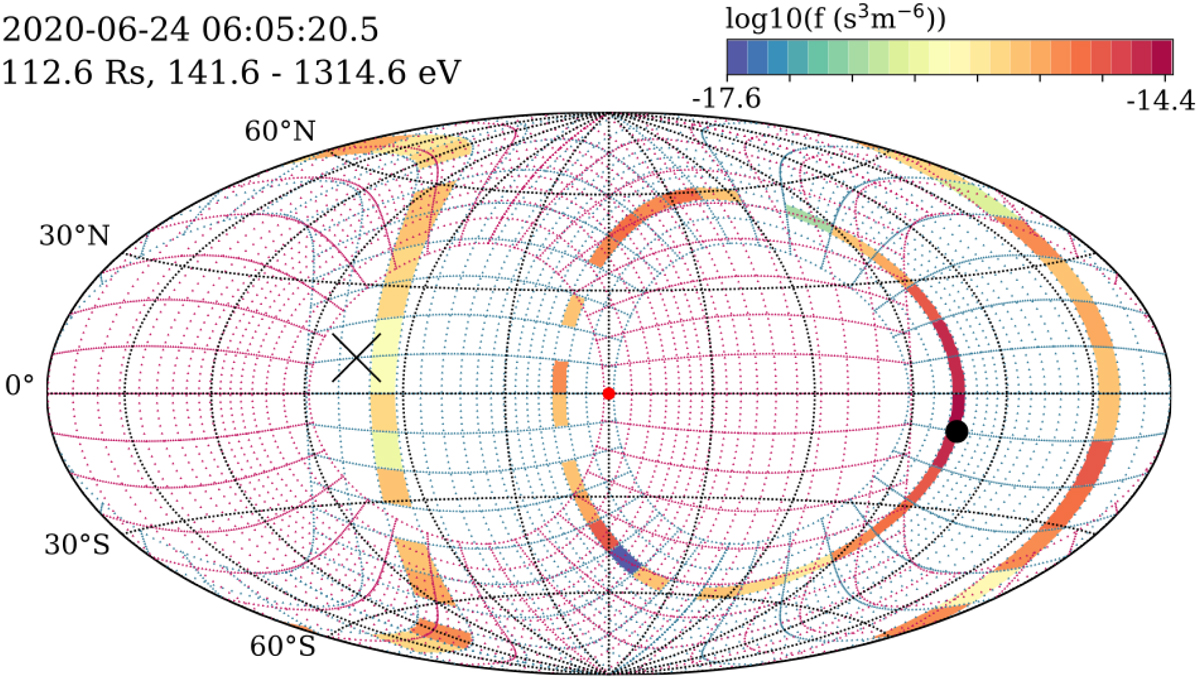
Fig. 2.
Download original image
A skymap representation of the combined EAS FOV in the spacecraft (SC) reference frame. The centre of the plot is aligned with the X-axis, 90° in longitude with the Y-axis, and latitude corresponds to the Z-axis. The angular bins are shown in blue for EAS 1 and in red for EAS 2. Two elevation bins of the EAS 1 head are filled with data obtained during one scan in the instrument Burst Mode (BM). The magnetic field direction is marked with a black dot (+B) and a black cross (−B).
Current usage metrics show cumulative count of Article Views (full-text article views including HTML views, PDF and ePub downloads, according to the available data) and Abstracts Views on Vision4Press platform.
Data correspond to usage on the plateform after 2015. The current usage metrics is available 48-96 hours after online publication and is updated daily on week days.
Initial download of the metrics may take a while.