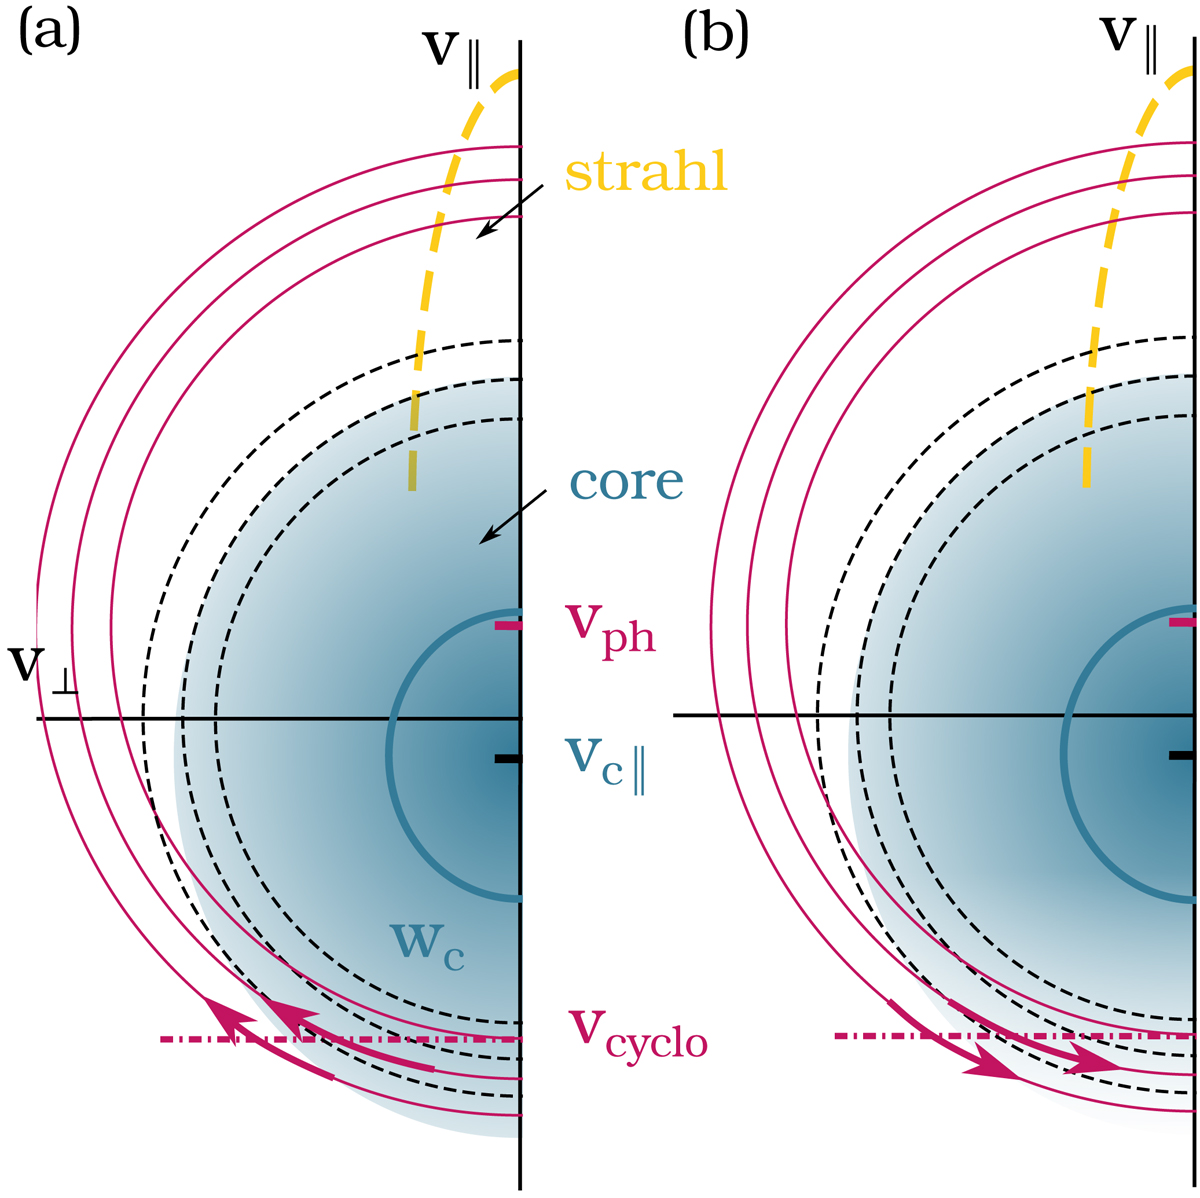
Fig. 1.
Download original image
Schematics of the whistler instability driven by the sunward deficit in the anti-strahl direction. The core population is shown as a blue shaded semi-circle, with a blue semi-circle marking its thermal velocity (wc) and vc∥ its bulk velocity in plasma rest frame. The dashed yellow curve indicates the strahl. Pink semi-circles mark curves of constant energy in the rest frame of the wave moving with vph = ω/k∥, and black dashed semi-circles the curves of constant kinetic energy in the plasma frame. Pink arrows indicate the electron diffusion paths. (a) Example without the sunward deficit; (b) The sunward deficit can trigger an instability.
Current usage metrics show cumulative count of Article Views (full-text article views including HTML views, PDF and ePub downloads, according to the available data) and Abstracts Views on Vision4Press platform.
Data correspond to usage on the plateform after 2015. The current usage metrics is available 48-96 hours after online publication and is updated daily on week days.
Initial download of the metrics may take a while.