Fig. 8.
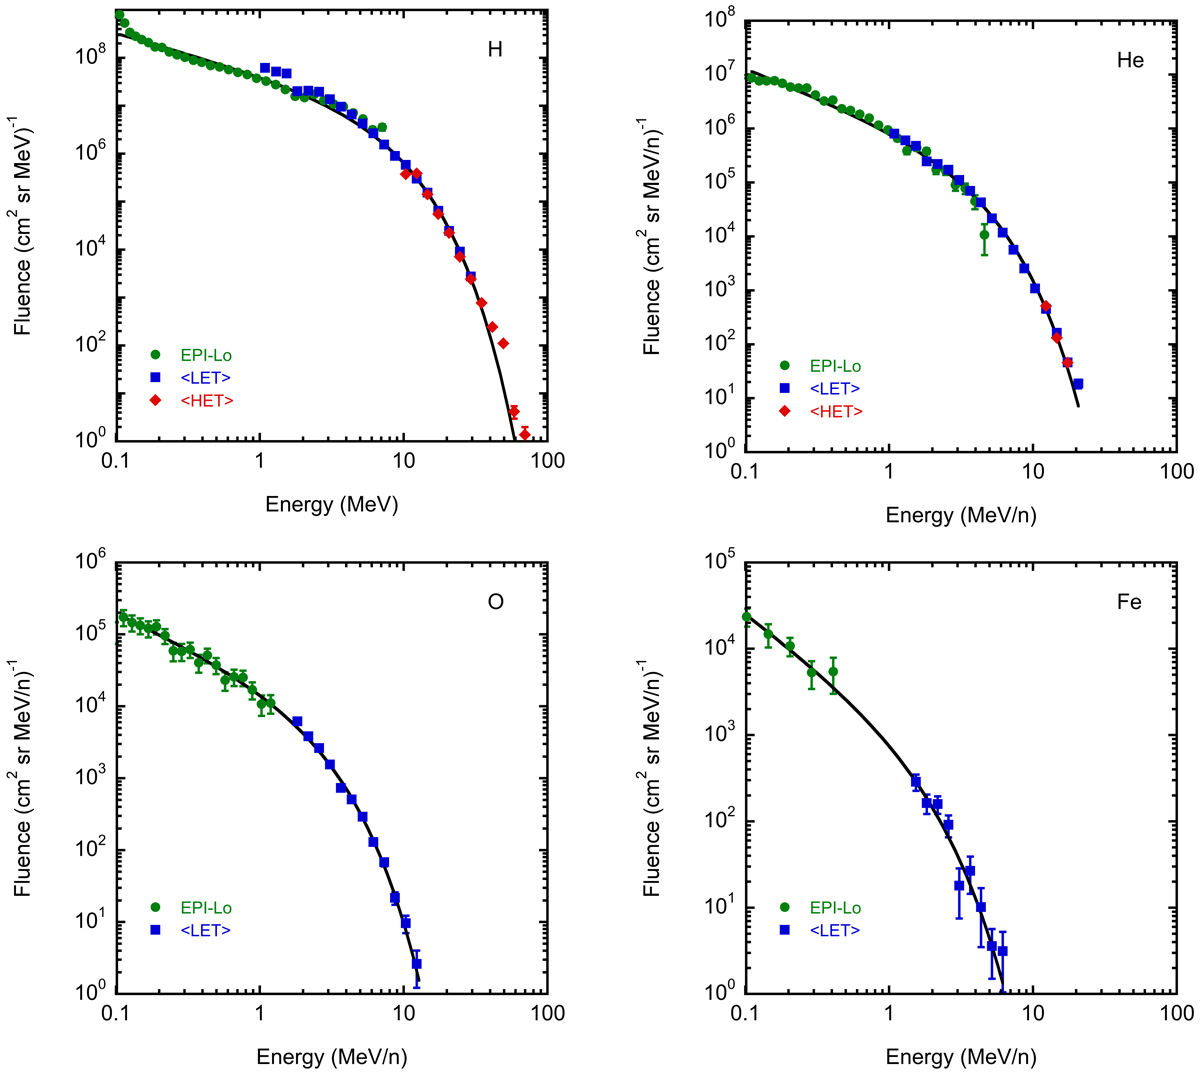
Download original image
Fluence spectra obtained during the decay of the SEP event (December 1 (day 336), 04:00 UT – December 4 (day 339), 17:00 UT) for H, He, O and Fe. H and He spectra combine data from EPI-Lo (green circles), the average of LETA and LETB (blue squares), and the average of HETA and HETB (red diamonds). O and Fe spectra do not have contributions from HET as the spectra did not extend into HET’s energy range. The uncertainties shown are statistical; absolute intensities may be uncertain by as much as 30% (see text for details). The black curves are Ellison-Ramaty fits; parameters are given in Table 2.
Current usage metrics show cumulative count of Article Views (full-text article views including HTML views, PDF and ePub downloads, according to the available data) and Abstracts Views on Vision4Press platform.
Data correspond to usage on the plateform after 2015. The current usage metrics is available 48-96 hours after online publication and is updated daily on week days.
Initial download of the metrics may take a while.