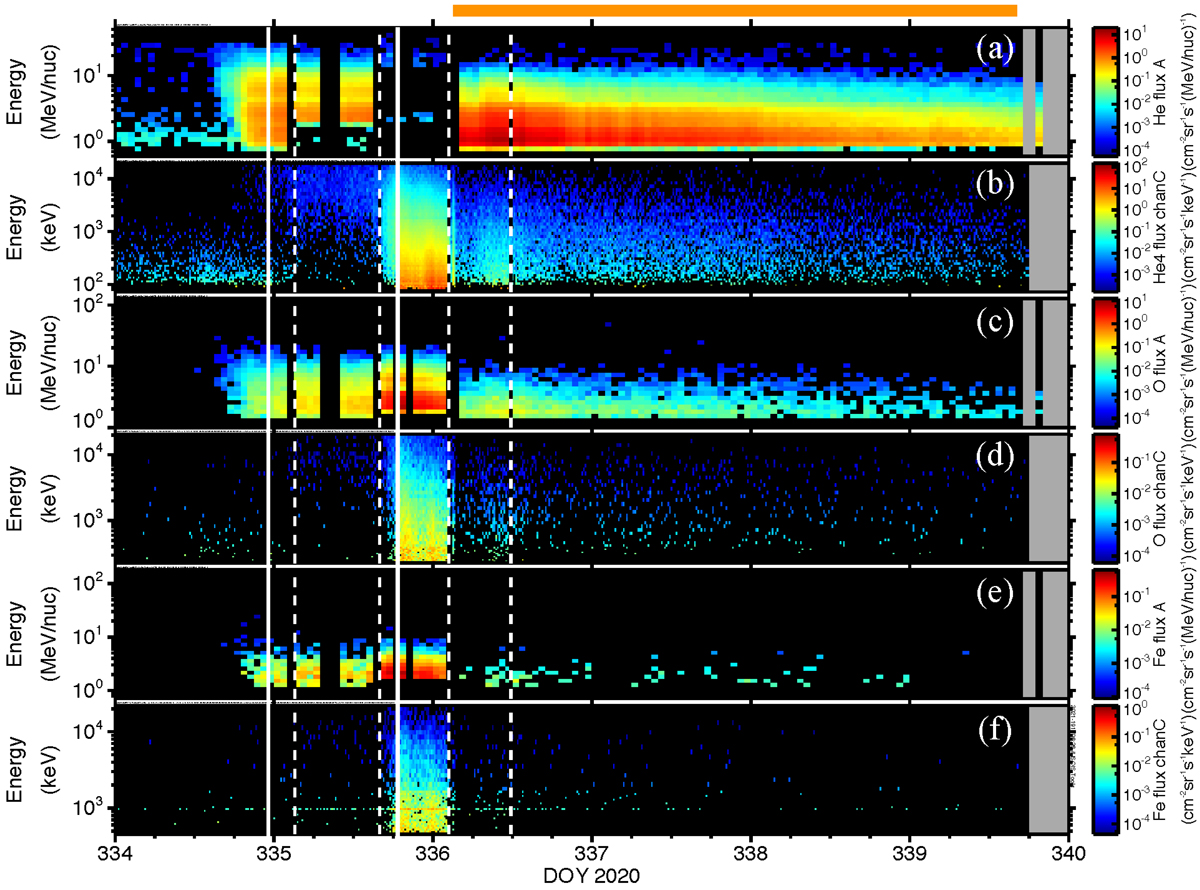
Fig. 7.
Download original image
Heavy ion spectrograms for the event in LETA/EPI-Lo panel pairs (upper and lower panels, respectively). Panels a and b: He intensities; c and d: oxygen intensities; and e and f: iron. See text for further explanation of the instrumental effects apparent in panel a. Solid vertical lines mark the passages of shocks and pairs of dashed lines indicate the magnetic cloud periods. The horizontal orange bar at the top indicates the integration period for the decay spectra.
Current usage metrics show cumulative count of Article Views (full-text article views including HTML views, PDF and ePub downloads, according to the available data) and Abstracts Views on Vision4Press platform.
Data correspond to usage on the plateform after 2015. The current usage metrics is available 48-96 hours after online publication and is updated daily on week days.
Initial download of the metrics may take a while.