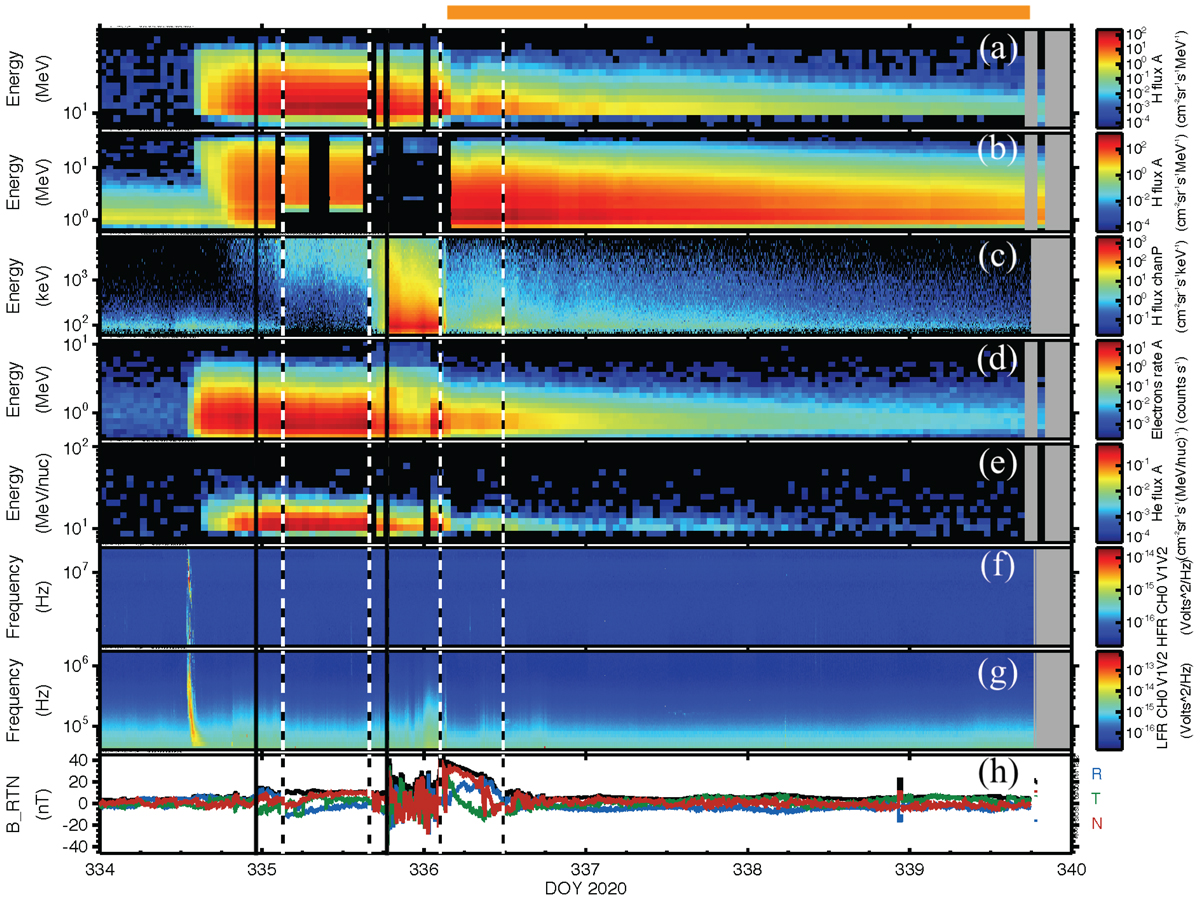
Fig. 6.
Download original image
Overview of the SEP event; panels a–c are protons from HETA, LETA, and EPI-Lo (respectively). Panels d and e: electron rate and He intensities from HETA. Panels f and g: high and low frequency radio observations and panel h: magnetic field magnitude (black line) and RTN components. The times of the shock passages are marked by the solid vertical lines and the periods of the magnetic clouds are bounded by the pairs of dashed vertical lines. The horizontal orange bar at the top indicates the integration period for the decay spectra. See text for further explanation of the instrumental effects apparent in panel b.
Current usage metrics show cumulative count of Article Views (full-text article views including HTML views, PDF and ePub downloads, according to the available data) and Abstracts Views on Vision4Press platform.
Data correspond to usage on the plateform after 2015. The current usage metrics is available 48-96 hours after online publication and is updated daily on week days.
Initial download of the metrics may take a while.