Fig. 2.
Download original image
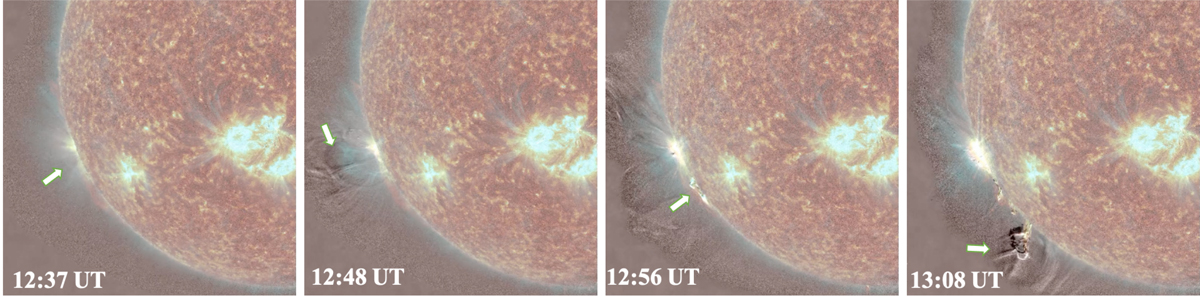
Snapshots of the CME early evolution as seen in AIA 131 Å (blue hues), 304 Å (red image) and 195 Å (running difference; black and white) channels. The arrows point to features discussed in the corresponding text (two left frames: formation of hot flux rope; two right frames: southern expansion and eruption of a filament). These constitute the two components of the CME detected in the coronagraphs. The full animation is available online.
Current usage metrics show cumulative count of Article Views (full-text article views including HTML views, PDF and ePub downloads, according to the available data) and Abstracts Views on Vision4Press platform.
Data correspond to usage on the plateform after 2015. The current usage metrics is available 48-96 hours after online publication and is updated daily on week days.
Initial download of the metrics may take a while.