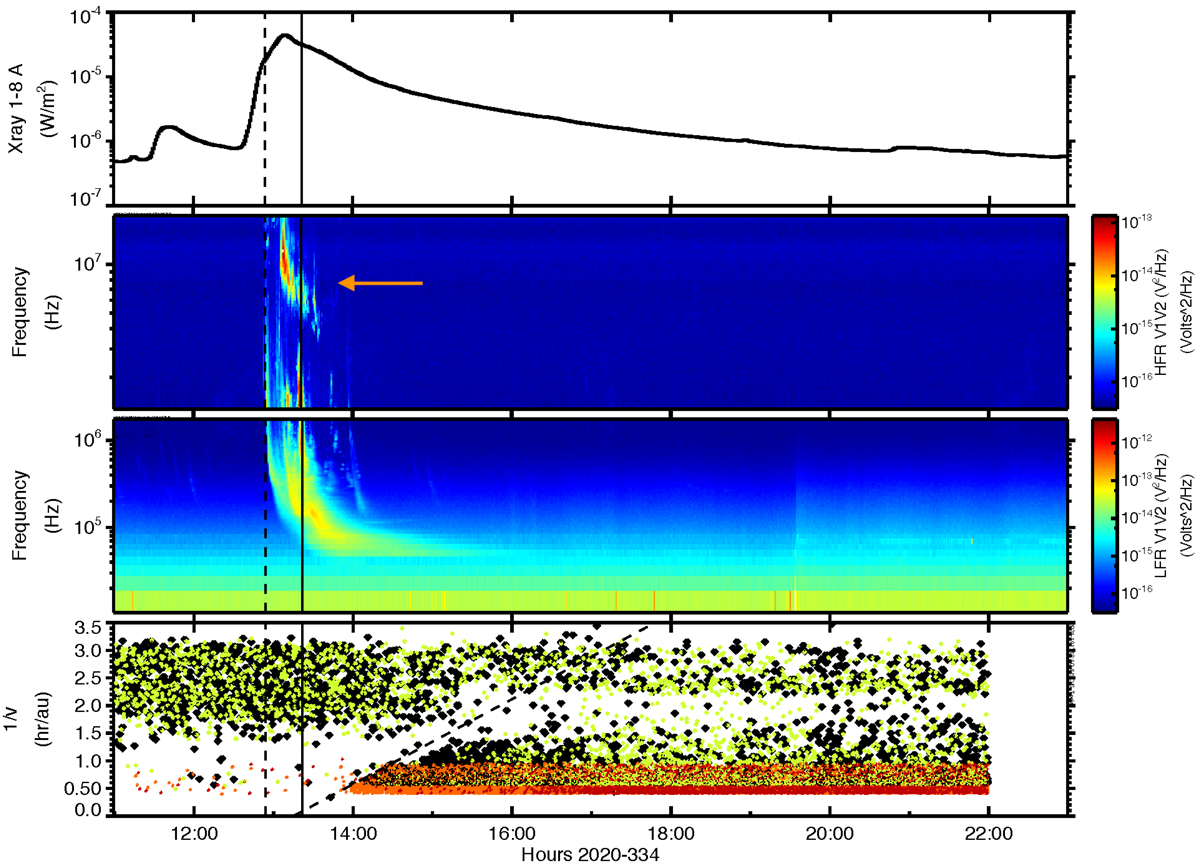
Fig. 13.
Download original image
Onset of the event showing the soft X-ray data from GOES-16 (top panel), the PSP radio high and low frequency observations (middle panels) and the inverse velocity of individual ions measured by LETA (black symbols), LETB (green symbols), HETA (orange symbols) and HETB (red symbols). The onset of the event is apparent as an ‘edge’ to the inverse velocity data points, fit by eye (over the range of ∼0.5−1.25 h au−1), and delineated by the dashed line. The x-intercept of this line corresponds to the release time of the particles at the Sun. This time, shifted by 6.67 min, is shown by the solid vertical line for comparisons with the X-ray and radio data. The start of the multiple type III radio bursts is marked by the dashed vertical line and a type II burst is indicated by the orange arrow.
Current usage metrics show cumulative count of Article Views (full-text article views including HTML views, PDF and ePub downloads, according to the available data) and Abstracts Views on Vision4Press platform.
Data correspond to usage on the plateform after 2015. The current usage metrics is available 48-96 hours after online publication and is updated daily on week days.
Initial download of the metrics may take a while.